


OpenTelemetry is an important specification that defines how we send telemetry data to observability backends like LaunchDarkly, Grafana, and others. OpenTelemetry is great because it is vendor agnostic, and can be used with several observability backends. If you’re new to OpenTelemetry, you can learn more about it here. This complete guide to OpenTelemetry in Next.js covers high-level concepts as well as how to send traces, logs, and metrics to your OpenTelemetry backend of choice.
Setting Up Open
Telemetry for Next.js: Tracing, Logging, and Metrics Let’s walk through setting up OpenTelemetry in a Next.js project, covering:- Tracing: Capturing distributed traces for API requests and page transitions
- Logging: Collecting structured logs that correlate with traces
- Metrics: Exporting performance and custom application metrics
- Built-in Spans: Next.js provides automatic spans at the framework level
- Exception Tracking: Errors are automatically captured within traces by the framework
- Simplified Setup: @vercel/otel eliminates the need to manually configure OpenTelemetry SDKs, exporters, and instrumentations
Installing Open
Telemetry in Next.js We’ve covered instrumenting Next.js with@vercel/otel in our blog post on using @vercel/otel in Next.js.
While @vercel/otel is a simpler option for many applications, it may not give you full control over the OpenTelemetry SDKs.
Today, we’ll go through a complete guide to setting up OpenTelemetry from scratch, explaining the configuration options along the way.
Setting Up the Open
Telemetry SDK Create a new fileotel.ts at the root of your Next.js project:
instrumentation.ts file.
Configuring Tracing
With the SDK configured, your application will start to export the telemetry data using the exporters defined. However, you may wonder what data is being captured without any explicit code added. Next.js has built-in OpenTelemetry spans for various parts of the application, including:- API routes (
pages/apiorapp/api) - Page router (Pages Directory)
- App router (App Directory)
NEXT_OTEL_VERBOSE environment variable will emit additional traces that give you more granularity of the code execution.
For example, here’s a flame graph visualization of a trace without verbose tracing, NEXT_OTEL_VERBOSE=0:
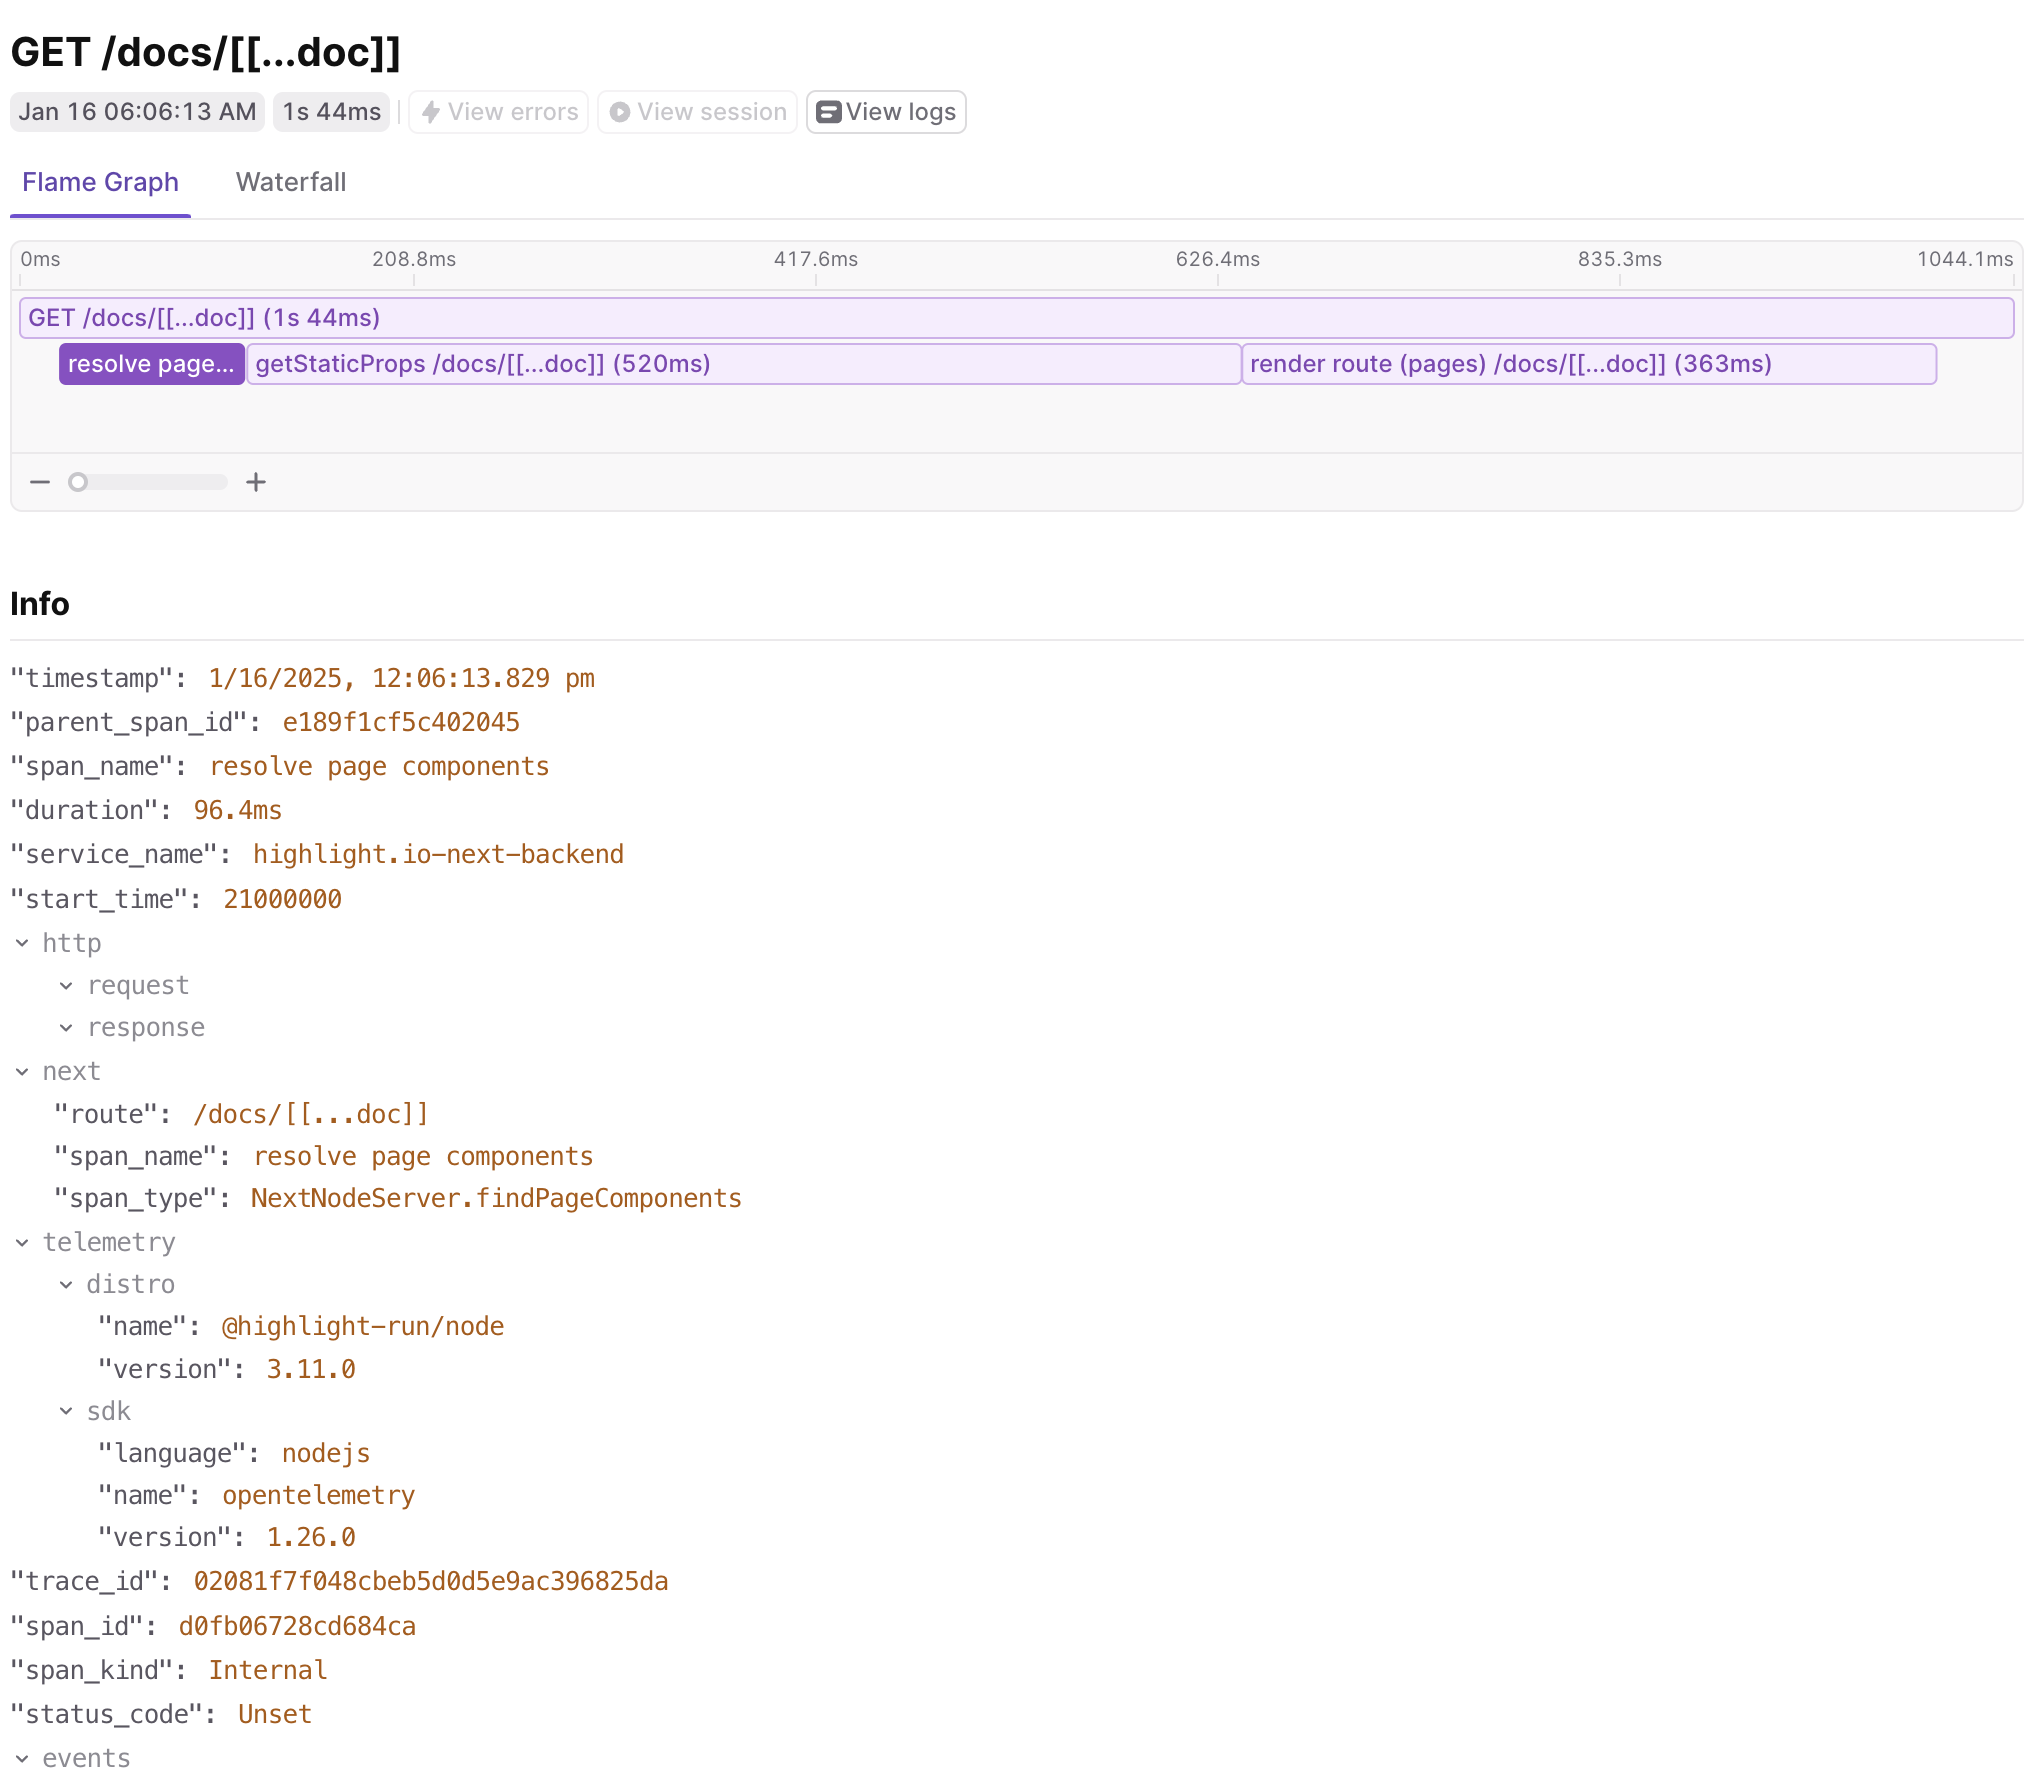
Flame graph visualization of a Next.js trace without verbose tracing enabled.
NEXT_OTEL_VERBOSE=1:
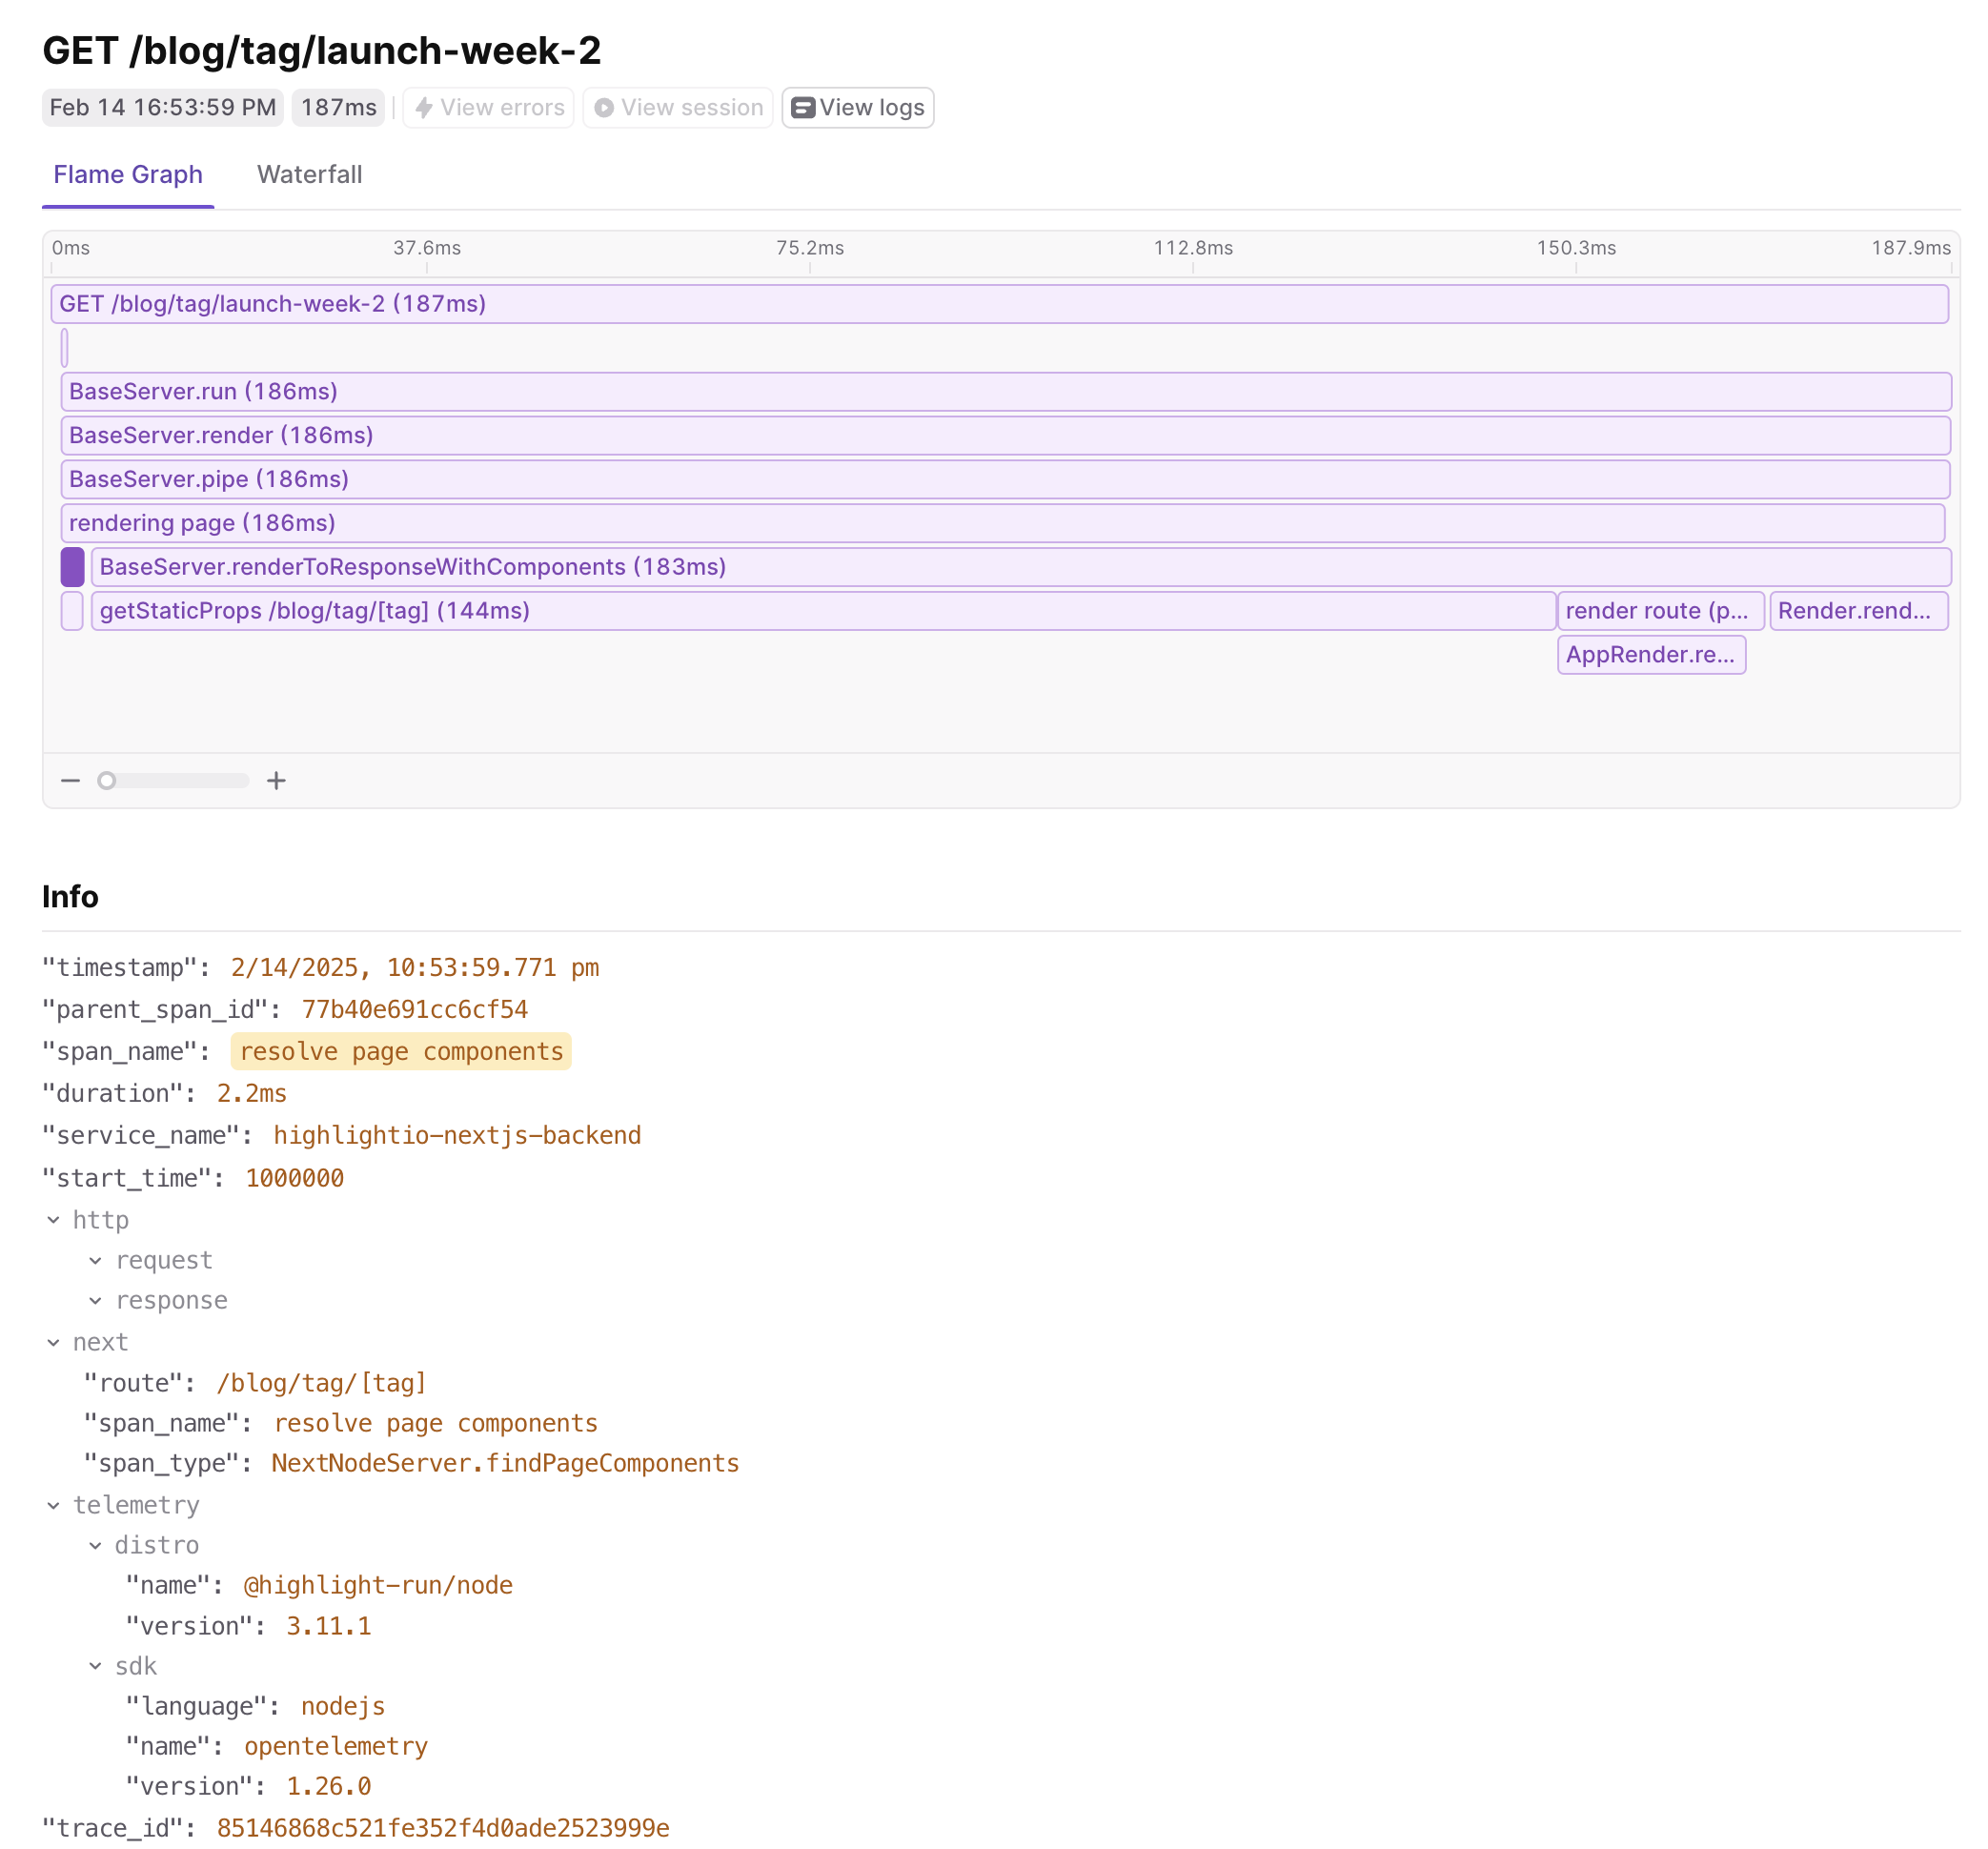
Flame graph visualization of the same Next.js trace with verbose tracing enabled showing additional spans.
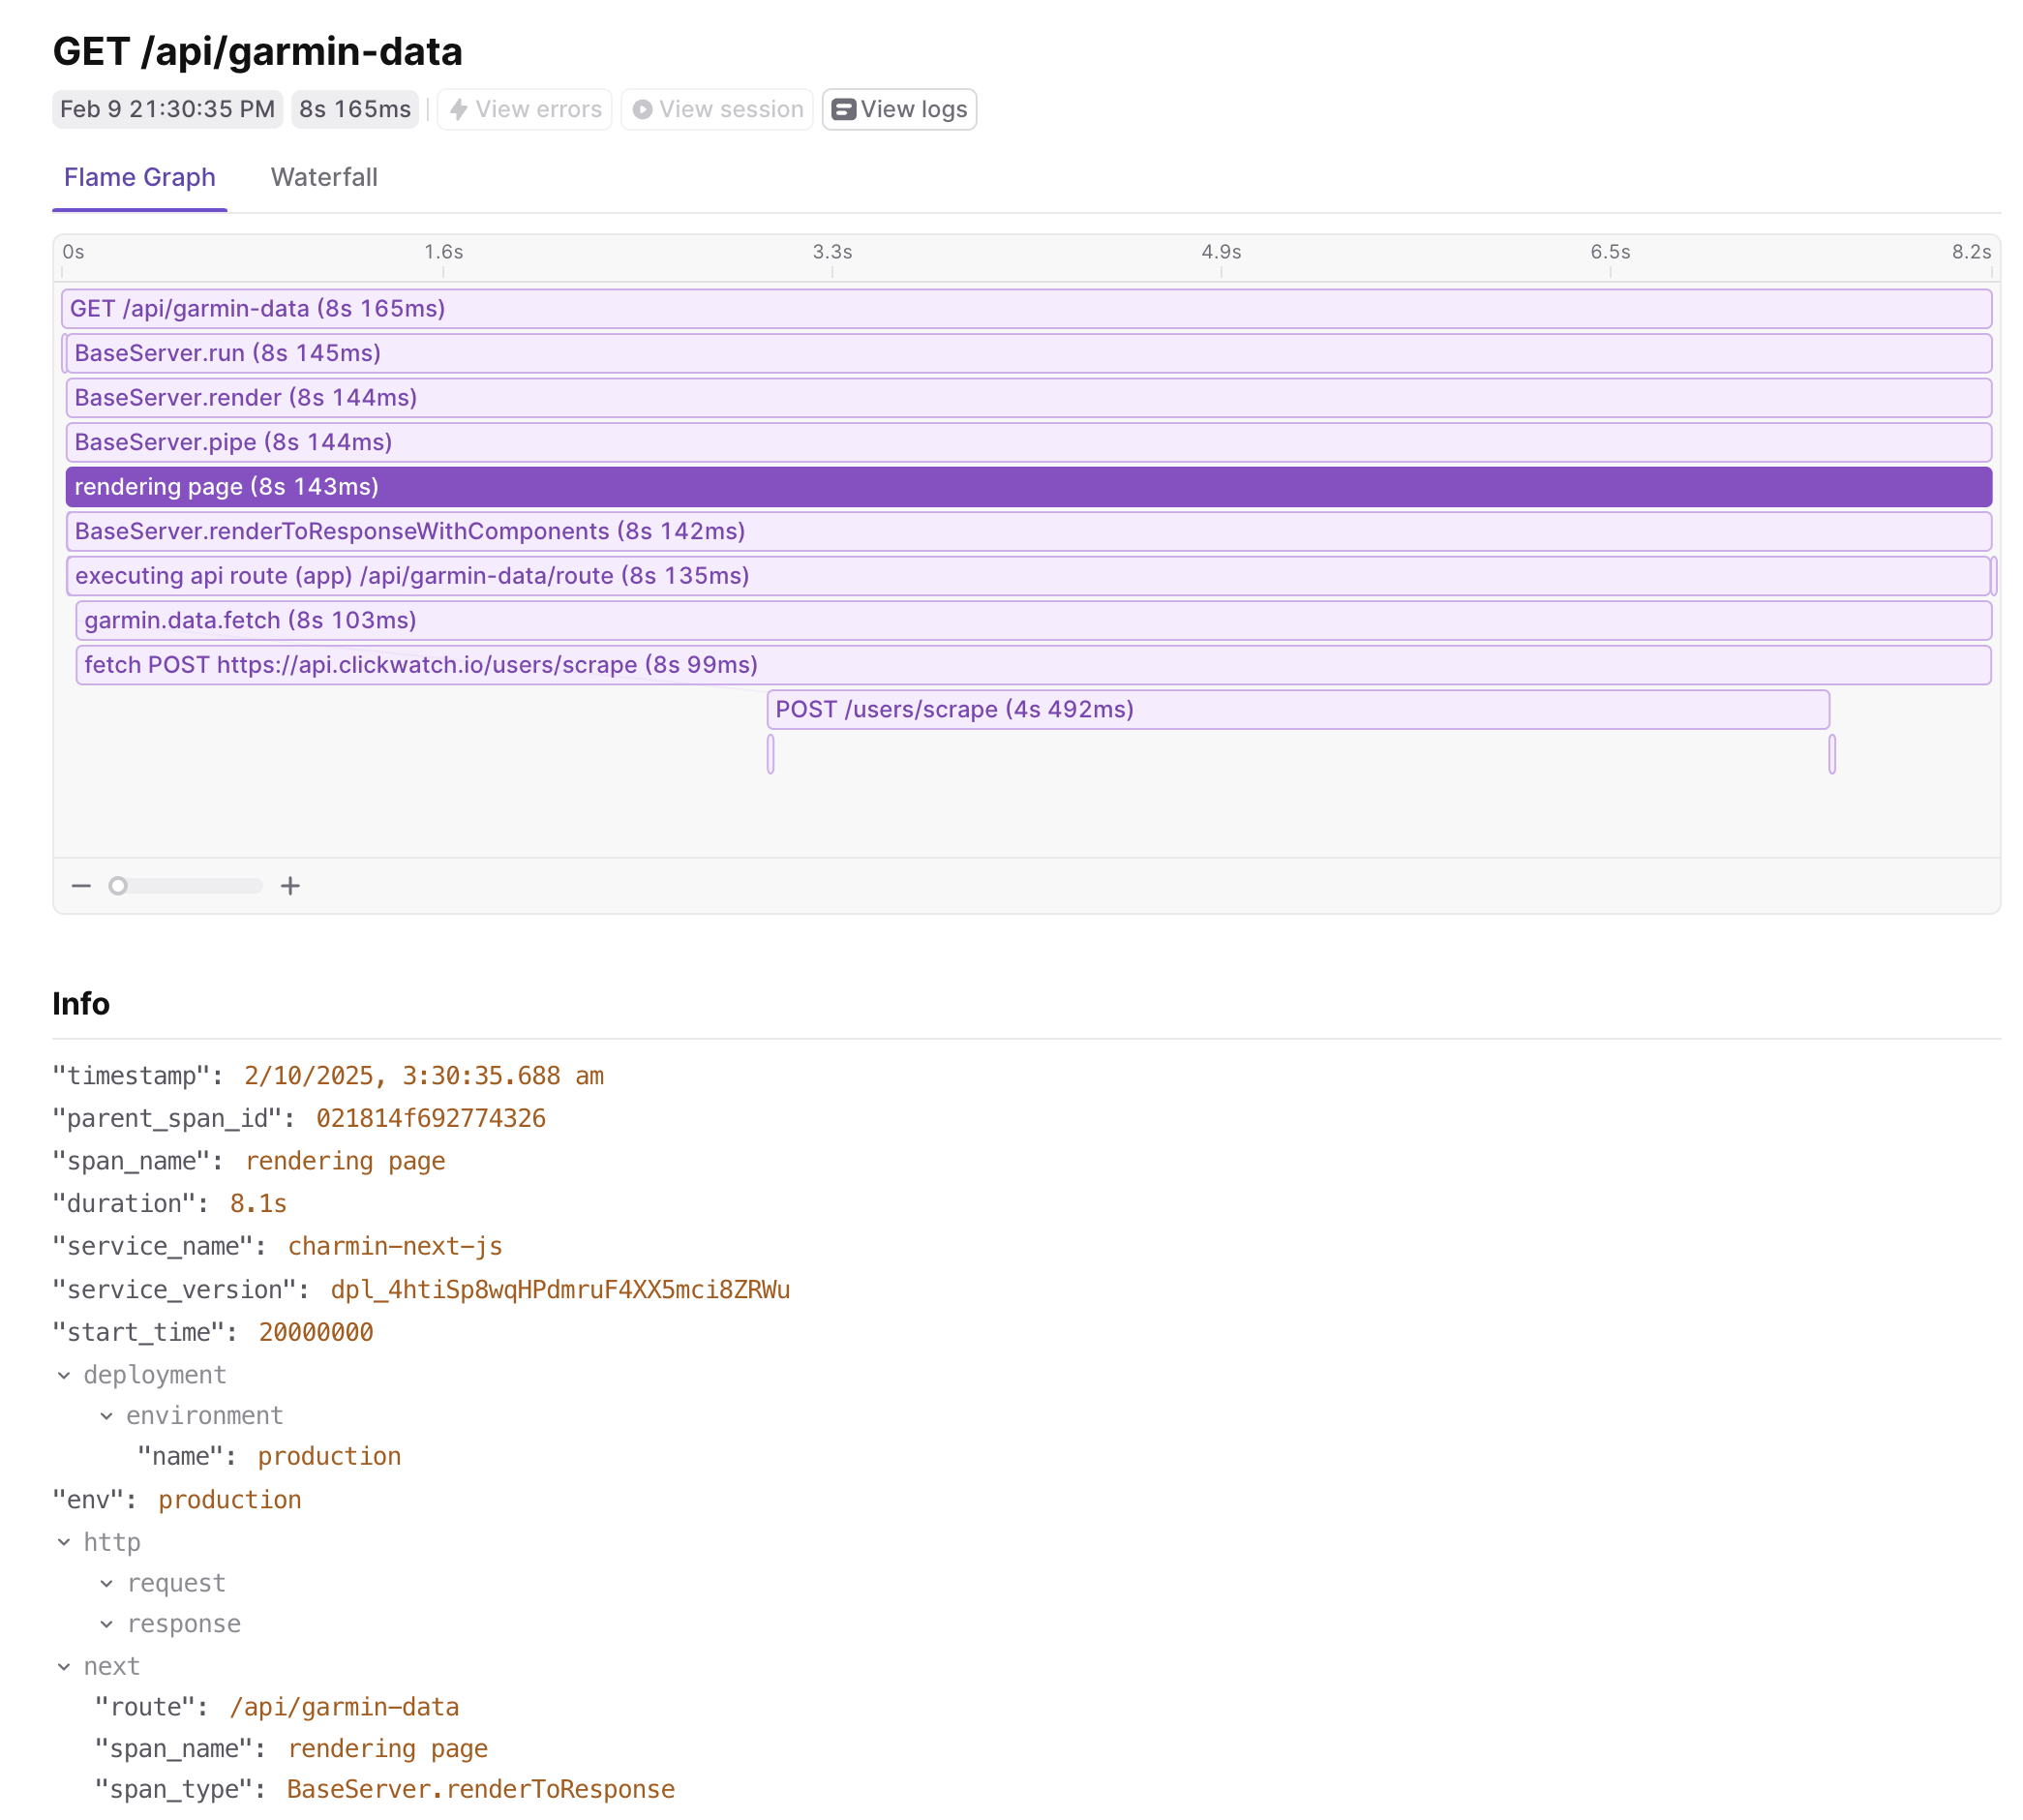
Trace view showing an API route request piped through Next.js with a custom span wrapping an outgoing fetch call.
fetch call automatically, and can even propagate the trace context to the backend service.
Here’s a list of the top-level spans that are captured automatically by Next.js:
- BaseServer.handleRequest - Named
[http.method] [next.route], the root span for each incoming request to your Next.js application. - AppRender.getBodyResult - Named
render route (app) [next.route], represents the process of rendering a route in the app router. - AppRender.fetch - Named
fetch [http.method] [http.url], represents the fetch request executed in your code. - AppRouteRouteHandlers.runHandler - Named
executing api route (app) [next.route], represents the execution of an API Route Handler in the app router. - Render.getServerSideProps - Named
getServerSideProps [next.route], represents the execution of getServerSideProps for a specific route. - Render.getStaticProps - Named
getStaticProps [next.route], represents the execution of getStaticProps for a specific route. - Render.renderDocument - Named
render route (pages) [next.route], represents the process of rendering the document for a specific route. - ResolveMetadata.generateMetadata - Named
generateMetadata [next.page], represents the process of generating metadata for a specific route. - NextNodeServer.findPageComponents - Named
resolve page components, represents the process of resolving page components for a specific page. - NextNodeServer.getLayoutOrPageModule - Named
resolve segment modules, represents loading of code modules for a layout or a page. - NextNodeServer.startResponse - Named
start response, represents the process of starting the response for a specific route.
Logging in Open
Telemetry Let’s add some more logic tootel.ts to create a logger that can be used to emit custom messages.
console.log, console.error, etc.,
you’ll need to manually instrument them to record their logs to the OpenTelemetry logger.
Here’s an example of how to do that:
Capturing Exceptions with Spans
Let’s emit a custom span in our code that can be used to capture an exception. We’ll start a span and then automatically add error attributes by capturing the error. Modify your API route:onRequestError hook that can be used to capture server errors.
You can use it in your instrumentation.ts file to intercept all server actions and capture the error:
Exporting Metrics
Next.js applications often benefit from metrics like request count, latency, and errors. Here’s how to add instrumentation for request tracking inotel.ts:
Putting it all together
Let’s put all of the pieces together and create a completeotel.ts file that will automatically instrument your Next.js app. Using @vercel/otel, we’ll configure export for LaunchDarkly, but you can use any other OpenTelemetry-compatible backend:
Conclusion
With the full suite of instrumentation configured, you’ll start to see valuable data in your LaunchDarkly dashboard. This data empowers you to enhance your troubleshooting workflows significantly. By visualizing response times, error rates, and detailed error reports, you can quickly identify performance bottlenecks and areas for improvement. For instance, if you notice a spike in response times for a specific API endpoint, you can drill down into the traces to see what might be causing the delay. Additionally, the error rate metrics allow you to monitor the health of your application in real-time. If an increase in errors is detected, you can leverage the detailed error reports to understand the context and root cause, enabling you to address issues proactively. Overall, integrating OpenTelemetry with LaunchDarkly not only provides you with observability but also equips you with the insights needed to optimize your application and enhance user experience. Start leveraging this powerful combination today to take your monitoring and troubleshooting capabilities to the next level!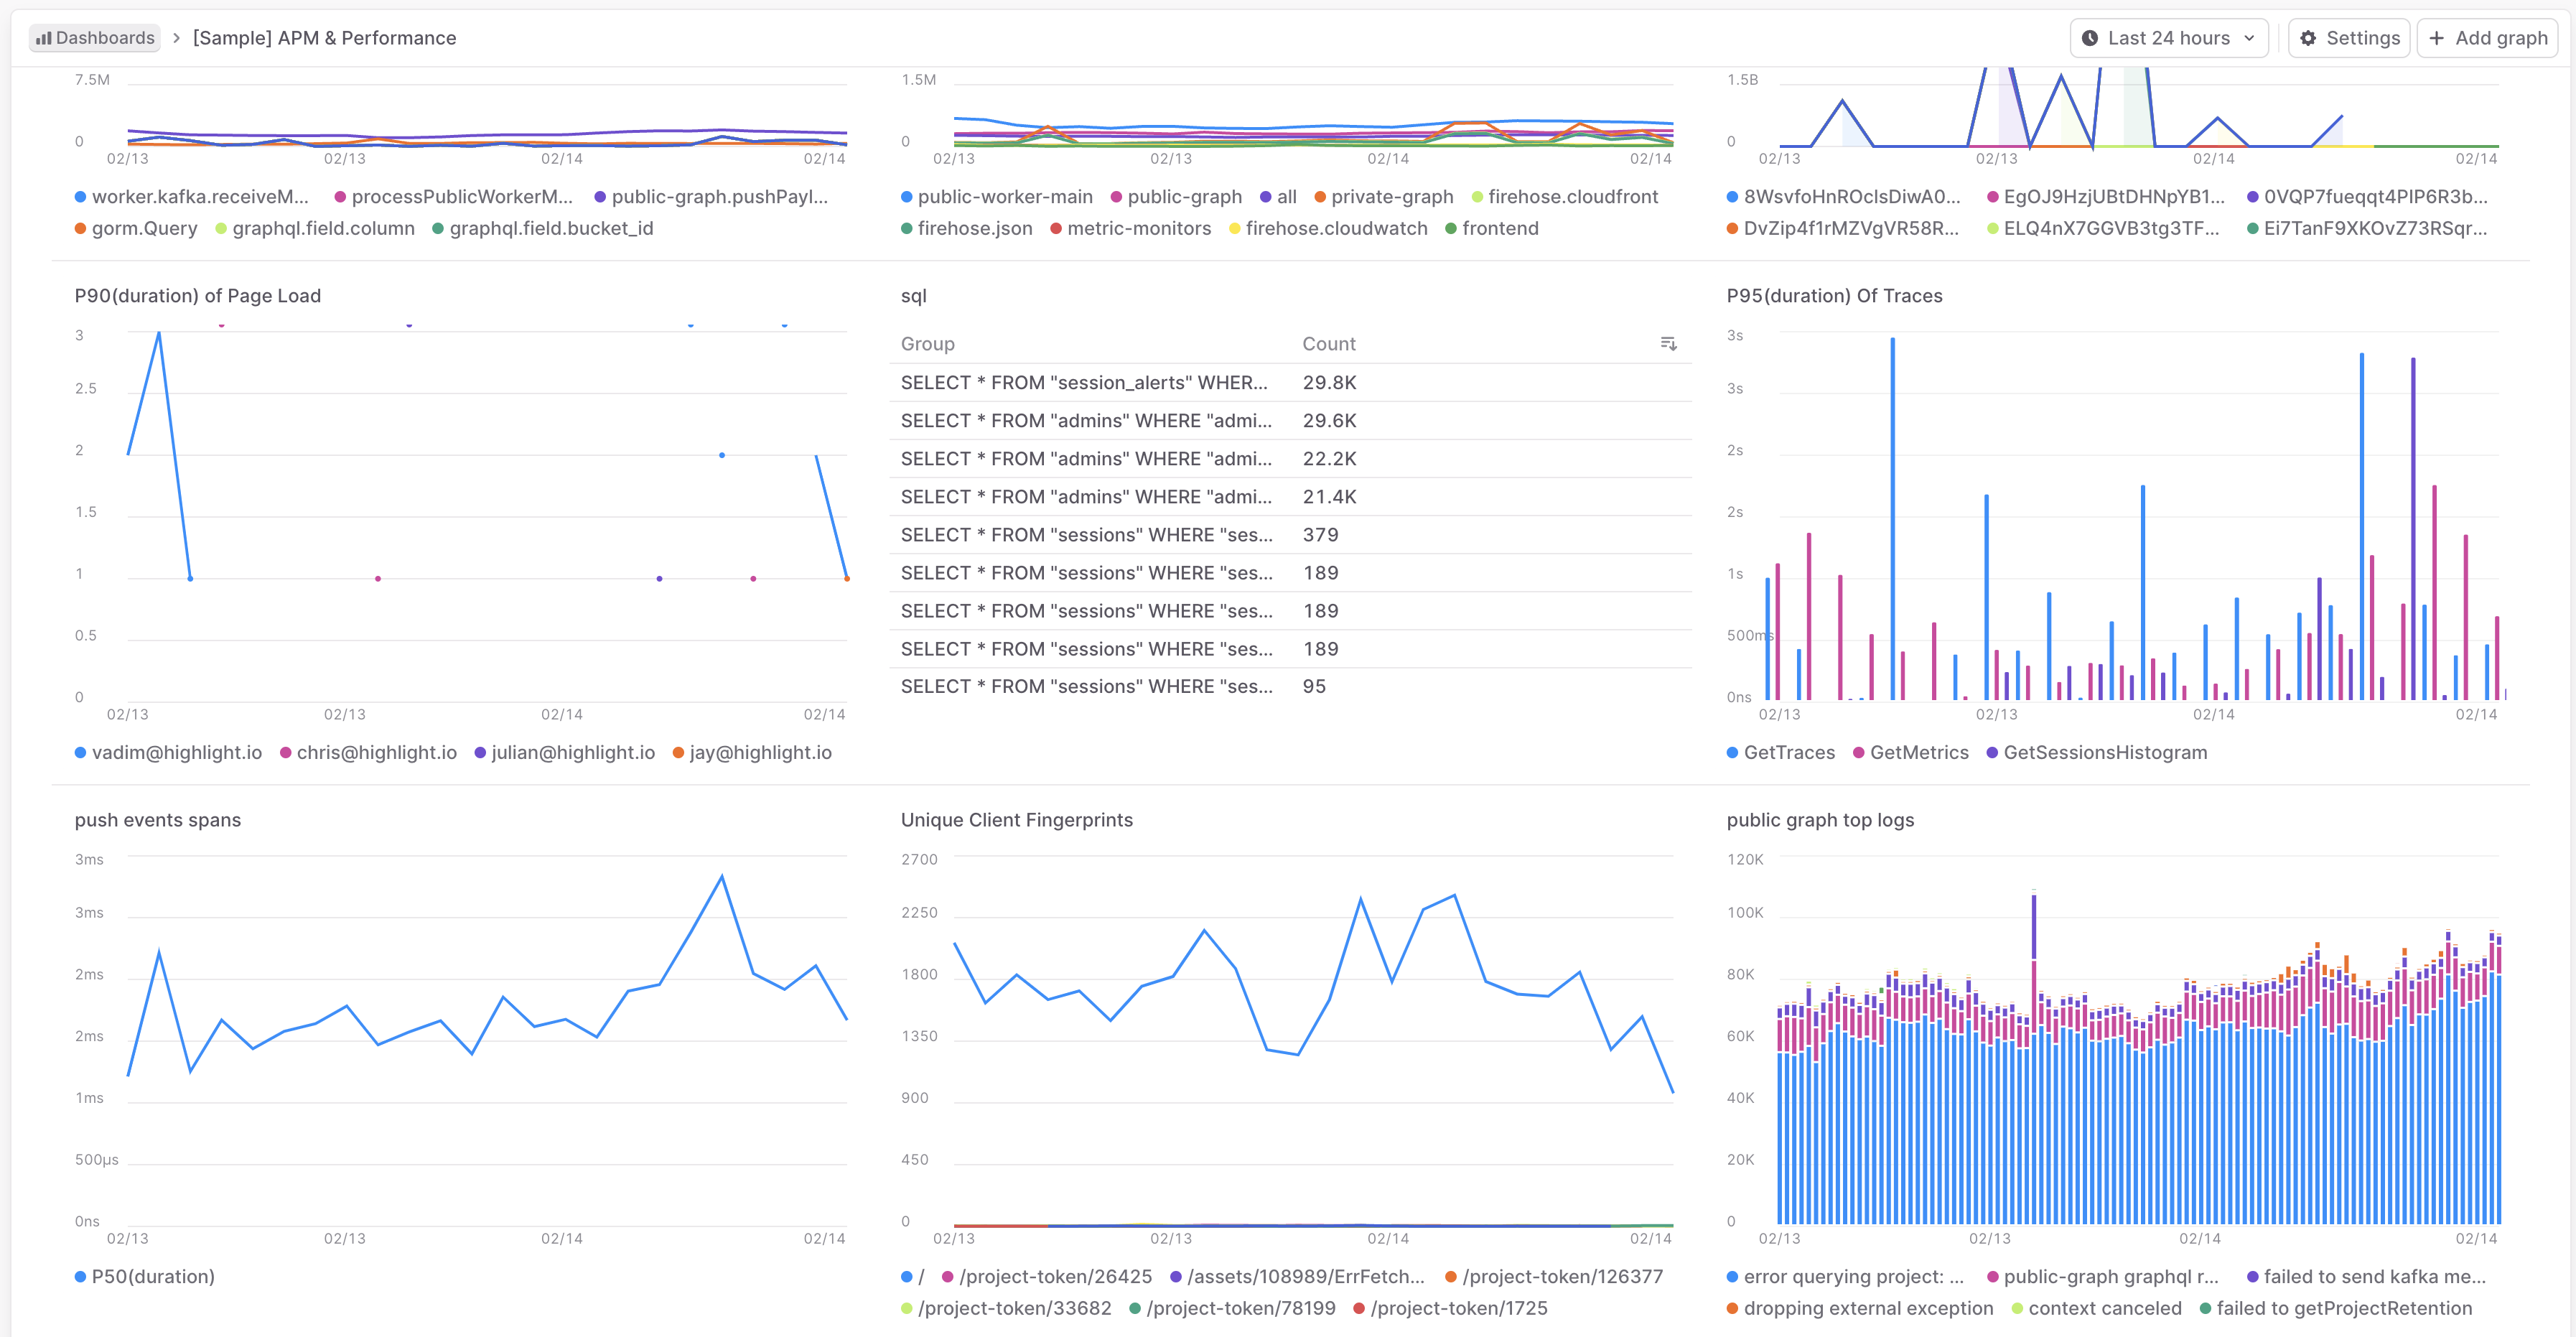
LaunchDarkly dashboard displaying traces, logs, and metrics from a Next.js application.