Documentation Index
Fetch the complete documentation index at: https://launchdarkly-preview.mintlify.app/llms.txt
Use this file to discover all available pages before exploring further.
Overview
This topic explains how to read the results of a multi-armed bandit (MAB). MABs automatically shift traffic to the leading variation over time, so you do not need to actively monitor a MAB, and you do not need to manually ship the leading variation. However, you can still use the Results tab to view the performance of each variation, and understand how the MAB is reallocating traffic. You can run a MAB indefinitely, allowing it to reallocate traffic as needed. If you don’t want to run a MAB indefinitely, we recommend that you stop it when a single variation’s probability to be best reaches 99% or higher. If you are running a MAB on a time-boxed feature, such as a holiday promotion, then you can stop the MAB iteration when the promotion is over.Summary
The “Summary” section displays the MAB’s optimization goal and key takeaways.Cumulative exposures
The “Cumulative exposures” section displays how many contexts have encountered each variation over time. Hover on the chart to display a breakdown of how many contexts encountered each variation on a specific date and time.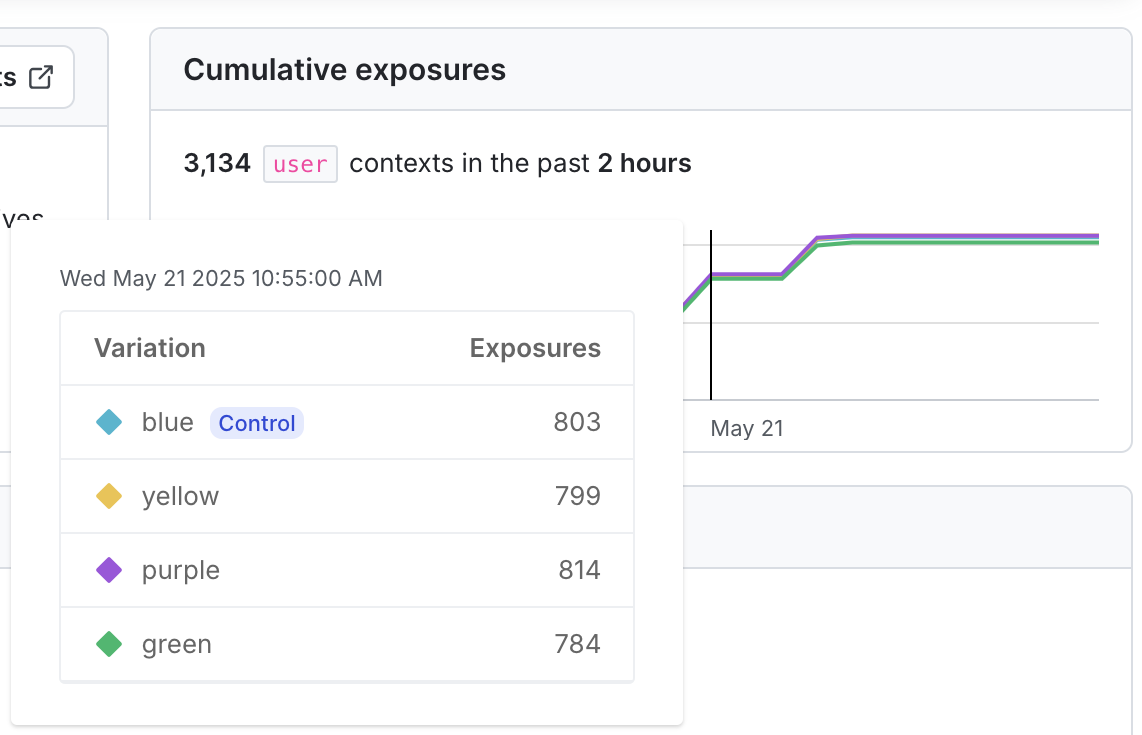
Cumulative results
The “Cumulative results” chart displays the leading variation, and, depending on the metric type, columns with information about probability to be best, conversion rate, conversions, mean, and exposures.Leading variation
The leading variation is the treatment that currently has the highest probability to be best. As the MAB runs, it will reallocate traffic to the leading variation at the frequency you specified when you created it. The current leading variation is indicated on the “Cumulative results” chart: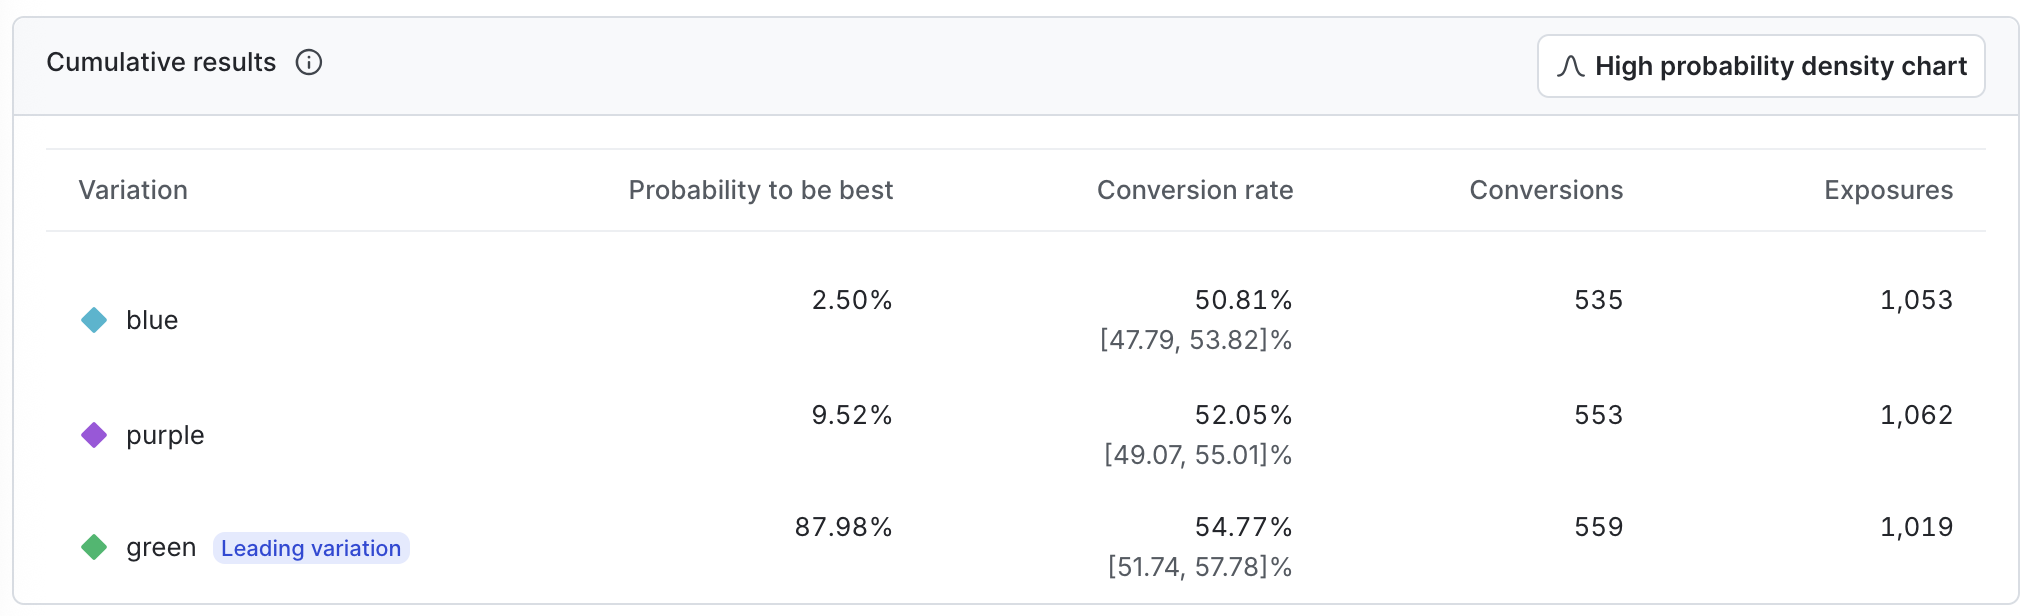
Probability density
The probability density chart displays the distribution of the results for the metric. Click Show probability density chart to display the chart, and Hide probability density chart to hide it.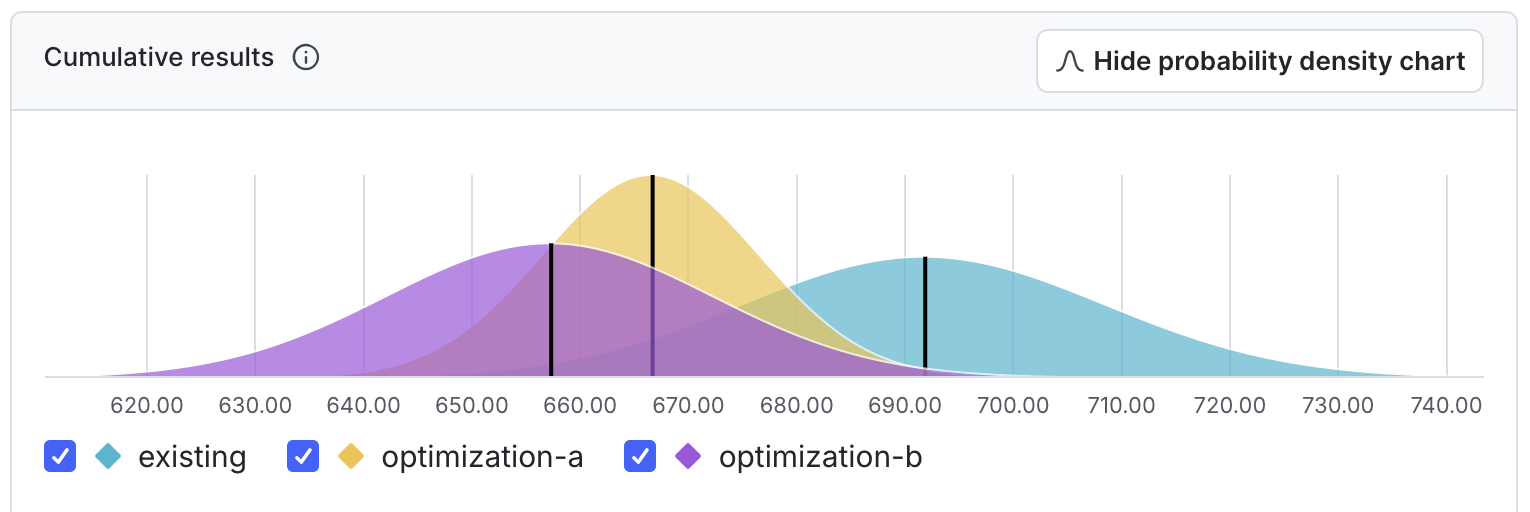
Probability to be best
The probability to be best for a variation is the likelihood that it outperforms all other variations for a specific metric. For MABs, the variation with the highest probability to be best is considered the leading variation. Additional columns in the “Cumulative results” chart display depending on the metric type you used in the MAB. Expand the sections below to view information for different metric types.Binary conversion metrics
Binary conversion metrics include:- Custom conversion binary metrics
- Clicked or tapped metrics using the Occurrence option
- Page viewed metrics using the Occurrence option
Expand Binary conversion metrics
Expand Binary conversion metrics
Conversion rate
The value for each unit in a binary conversion metric can be either 1 or- A value of 1 means the conversion occurred, such as a user viewing a web page, or submitting a form. A value of 0 means no conversion occurred.
Conversions
The conversions column displays the total number of users or other contexts that had at least one conversion.Total exposures
The total exposures column displays the total number of contexts that encountered the metric as part of the MAB.Count conversion and numeric metrics
Count conversion and numeric metrics include:- Custom conversion count metrics
- Numeric metrics
- Clicked or tapped metrics using the Count option
- Page viewed metrics using the Count option
Expand Count conversion and numeric metrics
Expand Count conversion and numeric metrics