Documentation Index
Fetch the complete documentation index at: https://launchdarkly-preview.mintlify.app/llms.txt
Use this file to discover all available pages before exploring further.
Overview
This guide provides examples of metrics you can use with LaunchDarkly features such as Experimentation and guarded rollouts. Metrics measure audience behaviors in your app or product and how those behaviors are affected by different flag variations. You can use metrics to track all kinds of things, from how often end users access a URL to how long that URL takes to load a page. How you set up a metric varies depending on what you want to measure. The examples included in this guide will help you understand how to configure metrics to meet your business needs.Metrics and metric events
An event happens when someone takes an action in your app, such as clicking on a button, or when a system takes an action, such as loading a page. Your SDKs send these metric events to LaunchDarkly, where it can aggregate and analyze them using metrics. LaunchDarkly can then quantify the overall performance and health of your product and provide suggestions on how to respond. For example, you can set up a purchase event in your app that sends the following information to LaunchDarkly:- who made the purchase
- the amount of money spent
- the number of items purchasedThen you can configure a metric to calculate the average purchase total per user. With this metric, you can use Experimentation to compare two different versions of your shopping cart against each other to see which results in higher purchase totals, or use guarded rollouts to track purchase totals after you toggle on a site redesign to see if totals go up or down. To learn more about events, read about click events, page view events, and custom events. To learn about how SDKs send events to LaunchDarkly, read Sending custom events.
Create metrics
There are five different types of metrics in LaunchDarkly:- Clicked or tapped conversion: tracks how often an end user interacts with an element of your product’s UI.
- Custom conversion binary: tracks whether a custom event occurs. You can use this metric with any event you set up in your codebase.
- Custom conversion count: tracks how many times a custom event occurs. You can use this metric with any event you set up in your codebase.
- Custom numeric: tracks changes to the amount of something, such as dollars spent or latency time.
- Page viewed conversion: tracks page views. You do not need to understand each of these options in-depth to use this guide, because each of the provided examples includes the suggested metric types. However, if you want a full explanation of each of these options, read Choose a metric type.
Metric definition options
When you create a metric, you select an event to measure and then configure how the metric aggregates event values to contexts, and how collected data for the metric should be analyzed by an attached experiment or guarded rollout. The configuration options vary based on metric type you create. Expand a section below to read about the configuration options for each metric type.Clicked or tapped conversion metric options
Clicked or tapped conversion metric options
Clicked or tapped conversion metric options
When you create a clicked or tapped conversion metric, you first provide one or more CSS selectors to define the interface elements that should generate events, as well as the target URLs that should generate events. Compatible LaunchDarkly client-side SDKs use this information to automatically generate events when users click the associated targets.Next, you must decide:- What do you want to measure:
- Count: the number of times a target was clicked.
- Occurrence: whether or not a target was clicked.
-
Analysis method:
- for metrics measuring Count, you can analyze by:
- Average: “average” is the default analysis method. This method calculates the average or arithmetic mean number of clicks or taps per context collected for the duration of an attached experiment or guarded rollout.
- Percentile: you can choose between P50-P99, which represent the 50th through the 99th percentile. This method counts the clicks or taps per context, then finds the number of clicks or taps that fall into the chosen percentile.
- metrics that measure Occurrence automatically use the “average” analysis method.
- for metrics measuring Count, you can analyze by:
- Randomization unit: one or more context kinds, such as “user,” “device,” or “request,” for which the metric measures events.
Custom conversion binary metric options
Custom conversion binary metric options
Custom conversion binary metric options
To create a custom conversion binary metric, you must first select Occurrence for what you want to measure. Metrics that measure Occurrence can be used in funnel metric groups.Then, custom conversion binary metric definition options include:- Randomization unit: one or more context kinds, such as “user,” “device,” or “request,” for which the metric measures events.
- Success criteria:
- Higher is better: choose this option for metrics that measure positive things like cart checkouts or sign-ups.
- Lower is better: choose this option for metrics that measure negative things like errors.
Custom conversion count metric options
Custom conversion count metric options
Custom conversion count metric options
When you create a custom conversion count metric, you must first select Count for what you want to measure. Metrics that measure by Count cannot be used in funnel metric groups.Then, custom conversion count metric definition options include:- Analysis method:
- Average: “average” is the default analysis method. This method calculates the average or arithmetic mean number of conversions per context.
- Percentile: you can choose between P50-P99, which represent the 50th through the 99th percentile. This method counts the conversions per context, then finds the number of conversions that fall into the chosen percentile.
- Randomization unit: one or more context kinds, such as “user,” “device,” or “request,” for which the metric measures events.
- Success criteria:
- Higher is better: choose this option for metrics that measure positive things like cart checkouts or sign-ups.
- Lower is better: choose this option for metrics that measure negative things like errors.
Custom numeric metric options
Custom numeric metric options
Custom numeric metric options
When you create a custom numeric metric, you must first select Value / Size as the measurement. Numeric metrics cannot be included in funnel metric groups.Then, custom numeric metric definition options include:- Aggregation method:
- Sum: the total value per unit. For example, this option adds together the total purchase amount of all of a customer’s purchases.
- Average: the average value per unit. For example, this option takes the average purchase price of all of a customer’s purchases.
-
Analysis method:
- Average: “average” is the default analysis method. This method calculates the average or arithmetic mean of values collected per context.
- Percentile: you can choose between P50-P99, which represent the 50th through the 99th percentile.
- Randomization unit: one or more context kinds, such as “user,” “device,” or “request,” for which the metric measures event values.
-
Success criteria:
- Higher is better: choose this option for metric values that measure positive things like cart totals or sign-ups.
- Lower is better: choose this option for metric values that measure negative things like errors or latency.
-
Units without events:
- Exclude units that did not send any events from the analysis: this option is best for latency metrics. If LaunchDarkly never receives an event for a context instance, you do not want to default to 0 because LaunchDarkly would interpret this as an extremely fast latency time, which would skew or invalidate the results.
- Include units that did not send any events and set their value to 0: this option is best for metrics where an incomplete process can be treated the same as 0, such as tracking cart totals for an online store. In this example, customers who put items in their cart but never completed the checkout process are treated as if they purchased $0.
- Unit of measure: the label for what the metric is measuring, such as dollars or milliseconds.
Page viewed metric options
Page viewed metric options
Page viewed conversion metric options
When you create a page viewed conversion metric, you first define the target URLs that should generate events. Compatible LaunchDarkly client-side SDKs use this information to automatically generate events when users load the associated URL.Next, you must decide:- What do you want to measure:
- Count: the number of times a page was viewed.
- Occurrence: whether or not a page was viewed.
-
Analysis method:
- for metrics measuring count, you can analyze by:
- Average: “average” is the default analysis method. This method calculates the average or arithmetic mean number of page views per context.
- Percentile: you can choose between P50-P99, which represent the 50th through the 99th percentile. This method counts the page views per context, then finds the number of page views that fall into the chosen percentile.
- metrics that measure Occurrence automatically use the “average” analysis method.
- for metrics measuring count, you can analyze by:
- Randomization unit: one or more context kinds, such as “user,” “device,” or “request,” for which the metric measures event values.
Examples: average purchase price per user
This section includes the configuration options for common custom numeric metrics related to average purchase price per user. For all of the examples in this section, the randomization unit is “user.”Average purchase price per user: only users who made a purchase
Expand Average purchase price per user: only users who made a purchase
Expand Average purchase price per user: only users who made a purchase
You can use this custom numeric metric to learn the average amount of money spent by users who made a purchase.The metric configuration options include: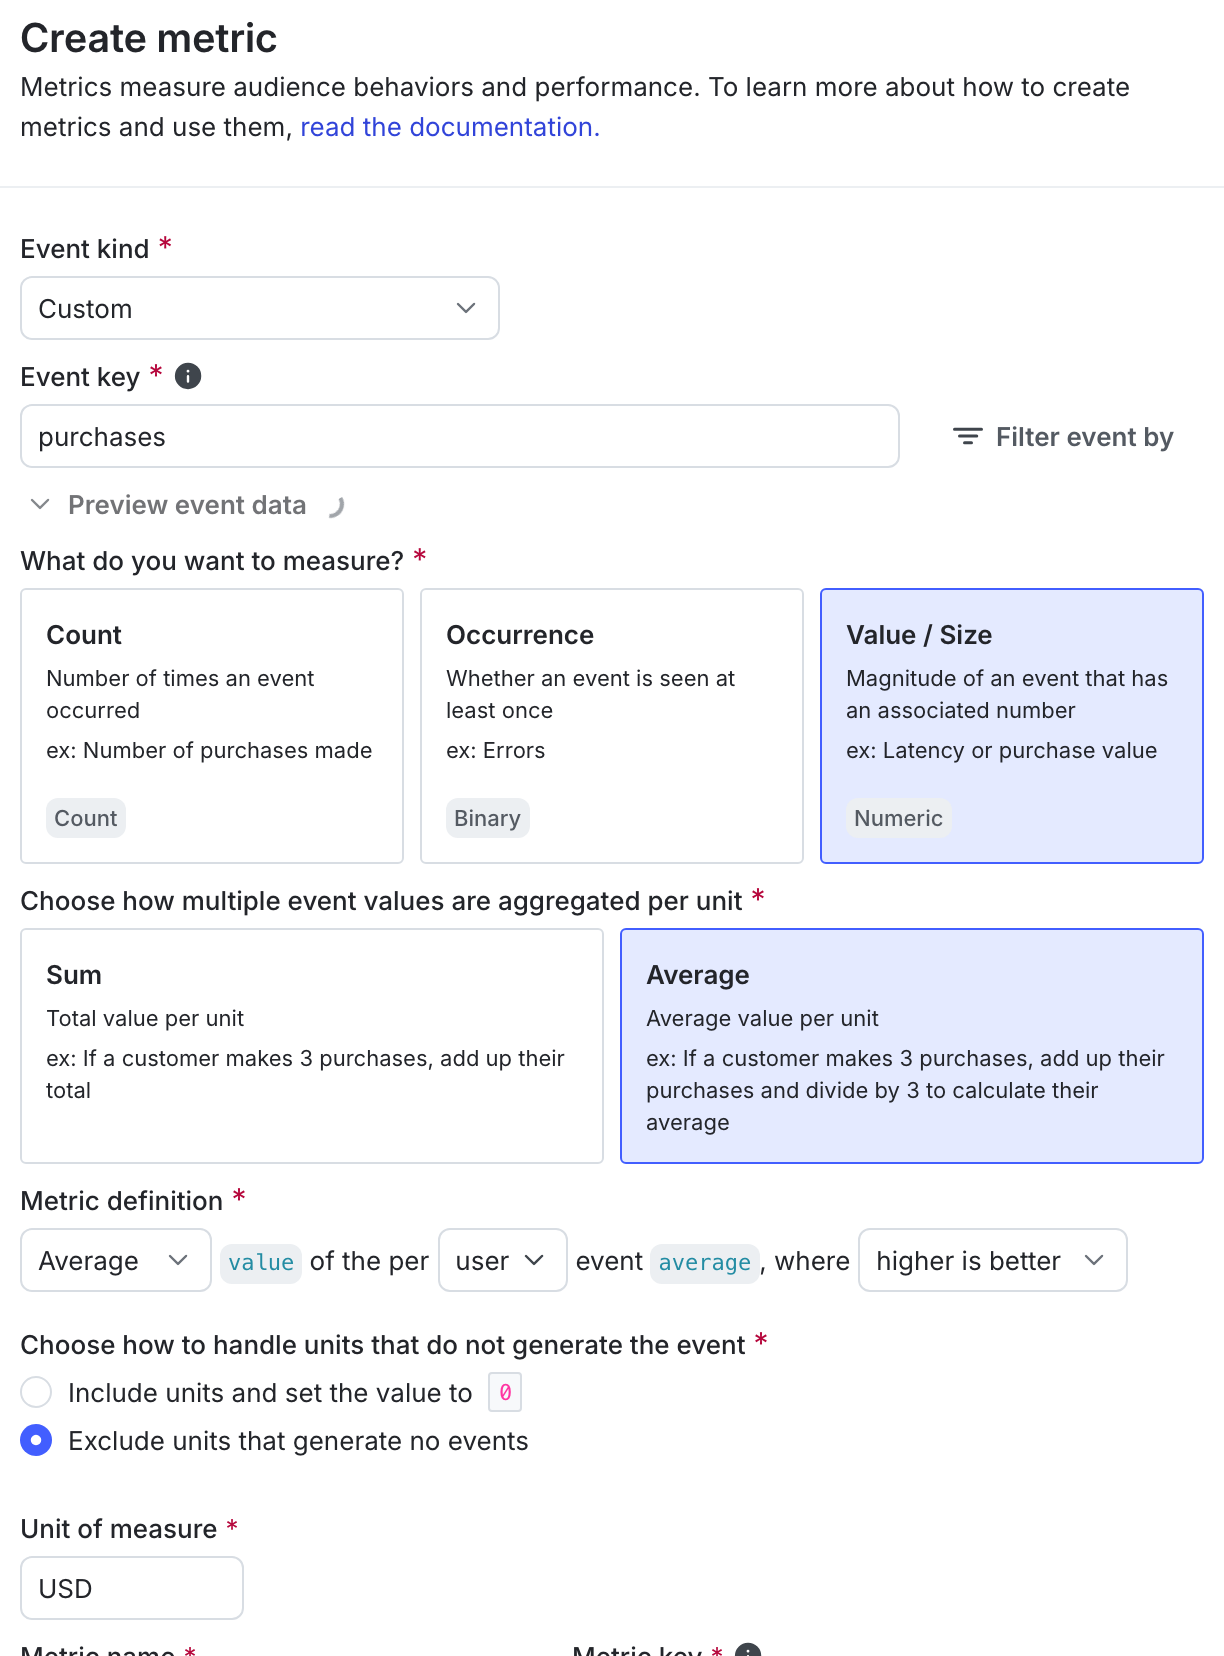 Here is an example of how the metric calculates its results:| Step 1| Step 2
| ---| --- |
| Users made the following purchases: * User A: 15 * User B: $10 * User C: $7 * User D: $0 (no purchases)| The metric calculates the average for each user, excluding those who didn’t purchase anything: * User A: $10 * User B: $10 * User C: $7| The metric then calculates the average purchase price per user: * Result: $9 |This means that buyers spend an average of $9.
- Event kind: Custom
- What do you want to measure: Value/size
- How multiple event values are aggregated per unit: Average
- Analysis method: Average
- Randomization unit: User
- Success criterion: Higher is better
- Units without events: Exclude units that did not send any events from the analysis
- Unit of measure: USD
| Step 3 |
|---|
Average purchase price per user: all users
Expand Average purchase price per user: all users
Expand Average purchase price per user: all users
You can use this custom numeric metric to learn the average amount of money spent by all users, whether or not they made a purchase.The metric configuration options include: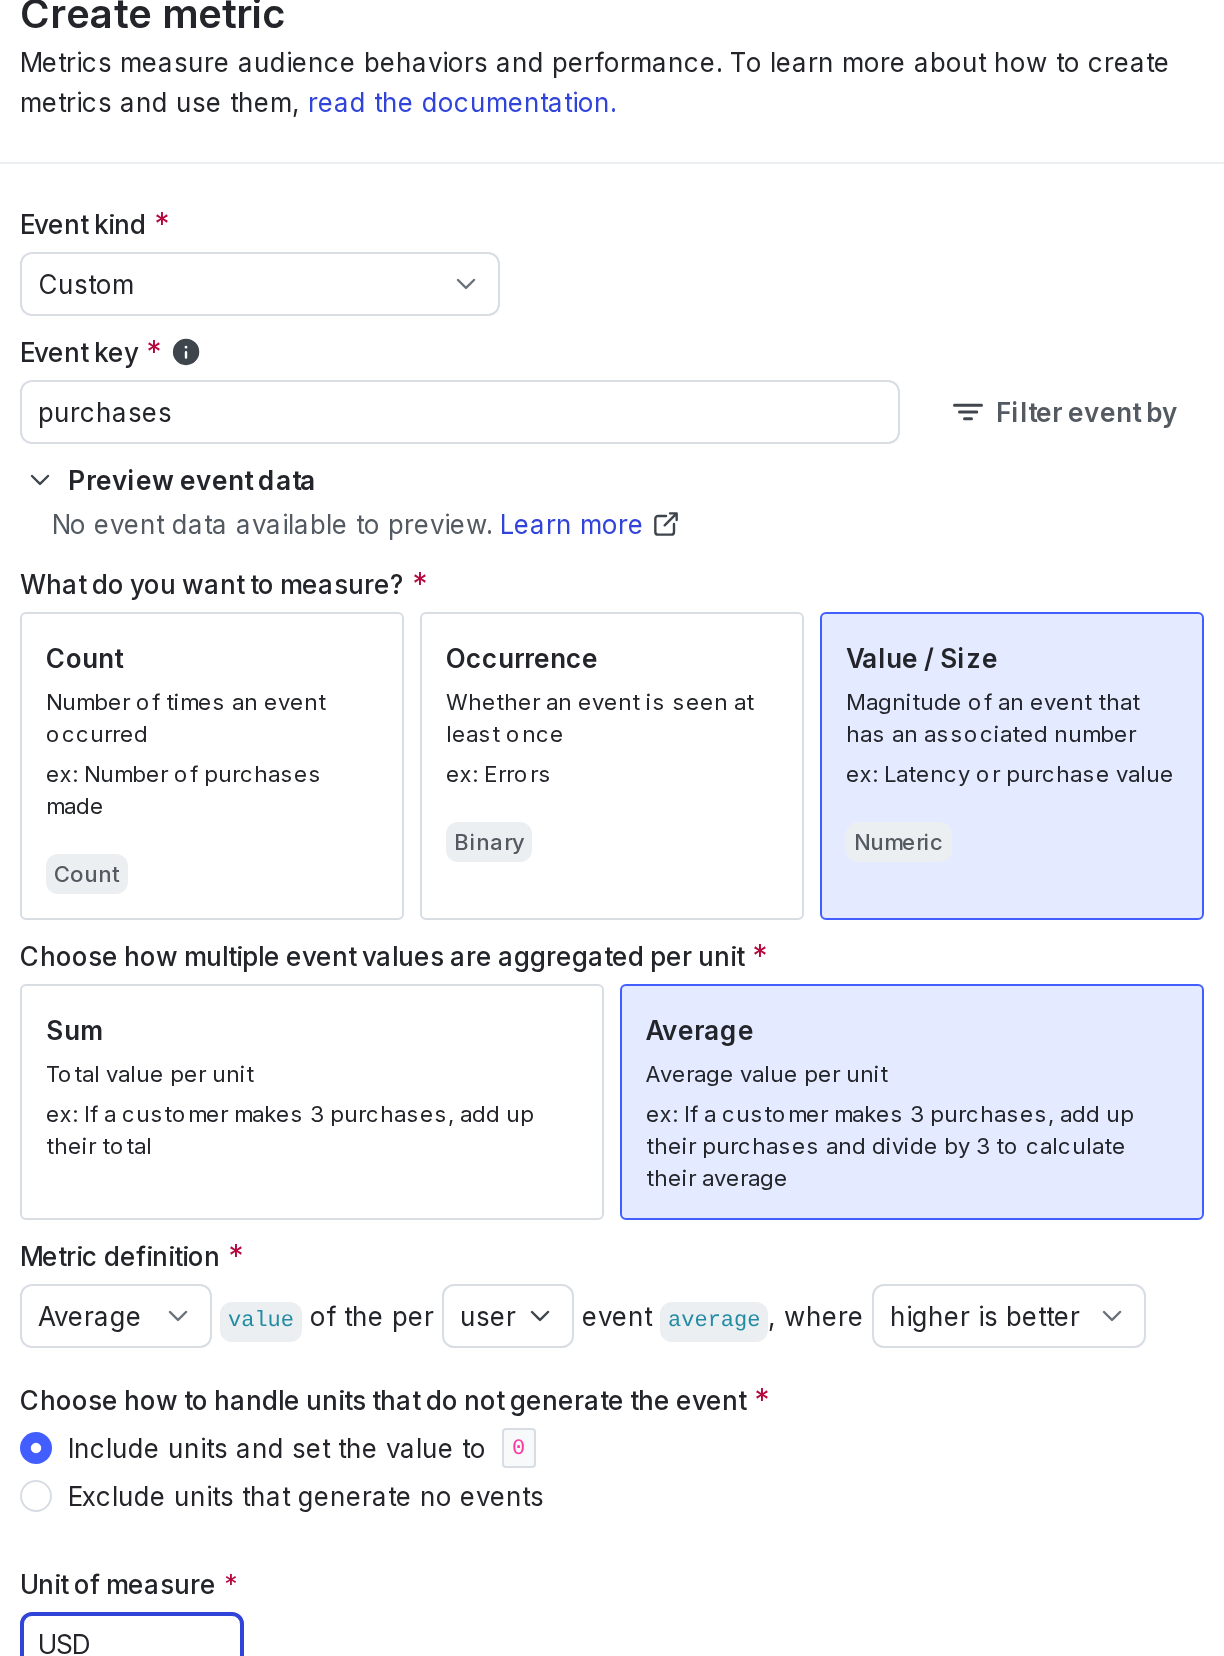 Here is an example of how the metric calculates its results:| Step 1| Step 2
| ---| --- |
| Users made the following purchases: * User A: 15 * User B: $10 * User C: $7 * User D: $0 (no purchases)| The metric calculates the average for each user, including those who didn’t purchase anything: * User A: $10 * User B: $10 * User C: $7 * User D: $0| The metric then calculates the average purchase price per user: * Result: $6.75 |This means that all users, including buyers and non-buyers, spend an average of $6.75.
- Event kind: Custom
- What do you want to measure: Value/size
- How multiple event values are aggregated per unit: Average
- Analysis method: Average
- Randomization unit: User
- Success criterion: Higher is better
- Units without events: Include units that did not send any events and set their value to 0
- Unit of measure: USD
| Step 3 |
|---|
Example: percentile purchase price per user
This section includes the configuration options for a custom numeric metric related to percentile purchase price per user. For the example in this section, the randomization unit is “user.”Expand Percentile purchase price per user
Expand Percentile purchase price per user
In this example, you are only interested in learning about your typical spenders and want to exclude the few customers who spend significantly more than most and skew your data upward. This metric calculates the amount of money that 90% of your customer base spends less than.This custom numeric metric only includes users who made a purchase. When using a percentile analysis method, LaunchDarkly automatically excludes units without events.The metric configuration options include: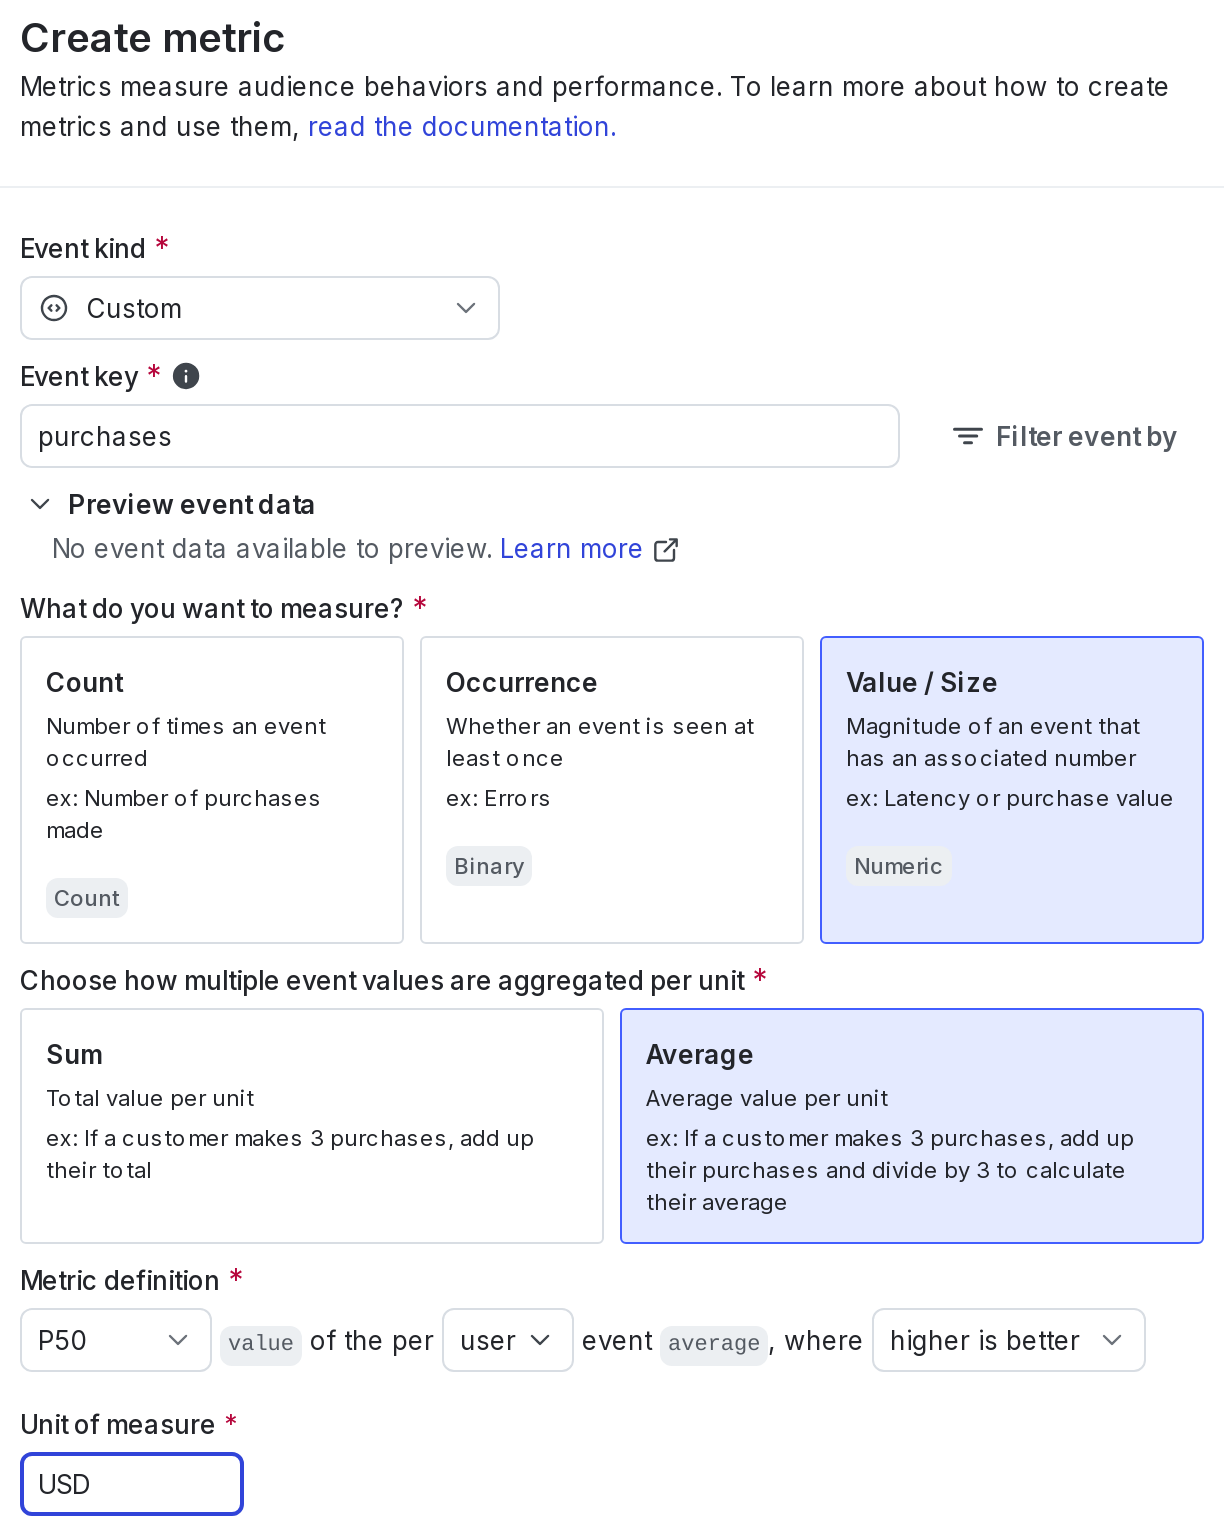 Here is an example of how the metric calculates its results:| Step 1| Step 2
| ---| --- |
| Users made the following purchases: * User A: $7 * User B: $9 * User C: $5, $15 * User D: $12 * User E: $21 * User F: $20, $40 * User G: $45 * User H: $78 * User I: $80 * User J: $85 * User K: $550 * User L: No purchases| The metric calculates the average for each user that made a purchase: * User A: $7 (0th percentile) * User B: $9 (10th percentile) * User C: $10 (20th percentile) * User D: $12 (30th percentile) * User E: $21 (40th percentile) * User F: $30 (50th percentile) * User G: $45 (60th percentile) * User H: $78 (70th percentile) * User I: $80 (80th percentile) * User J: $85 (90th percentile) * User k: $550 (100th percentile) * User L: Excluded from calculation| The metric then calculates the average for the 90th percentile: * Result: $85 |This means that 90% of all users that make a purchase spend less than $85.
- Event kind: Custom
- What do you want to measure: Value/size
- How multiple event values are aggregated per unit: Average
- Analysis method: P90
- Randomization unit: User
- Success criterion: Higher is better
- Unit of measure: USD
| Step 3 |
|---|
Examples: average revenue per user
This section includes the configuration options for common custom numeric metrics related to average revenue per user. For all of the examples in this section, the randomization unit is “user.”Average revenue per user: only users who generated revenue
Expand Average revenue per user: only users who generated revenue
Expand Average revenue per user: only users who generated revenue
This custom numeric metric sums purchase amounts per user who bought something, instead of calculating average amounts per purchase. This lets you find out about the purchasing behavior of users as a whole, ignoring whether the money they spent was all at once or spread between multiple purchases.The metric configuration options include: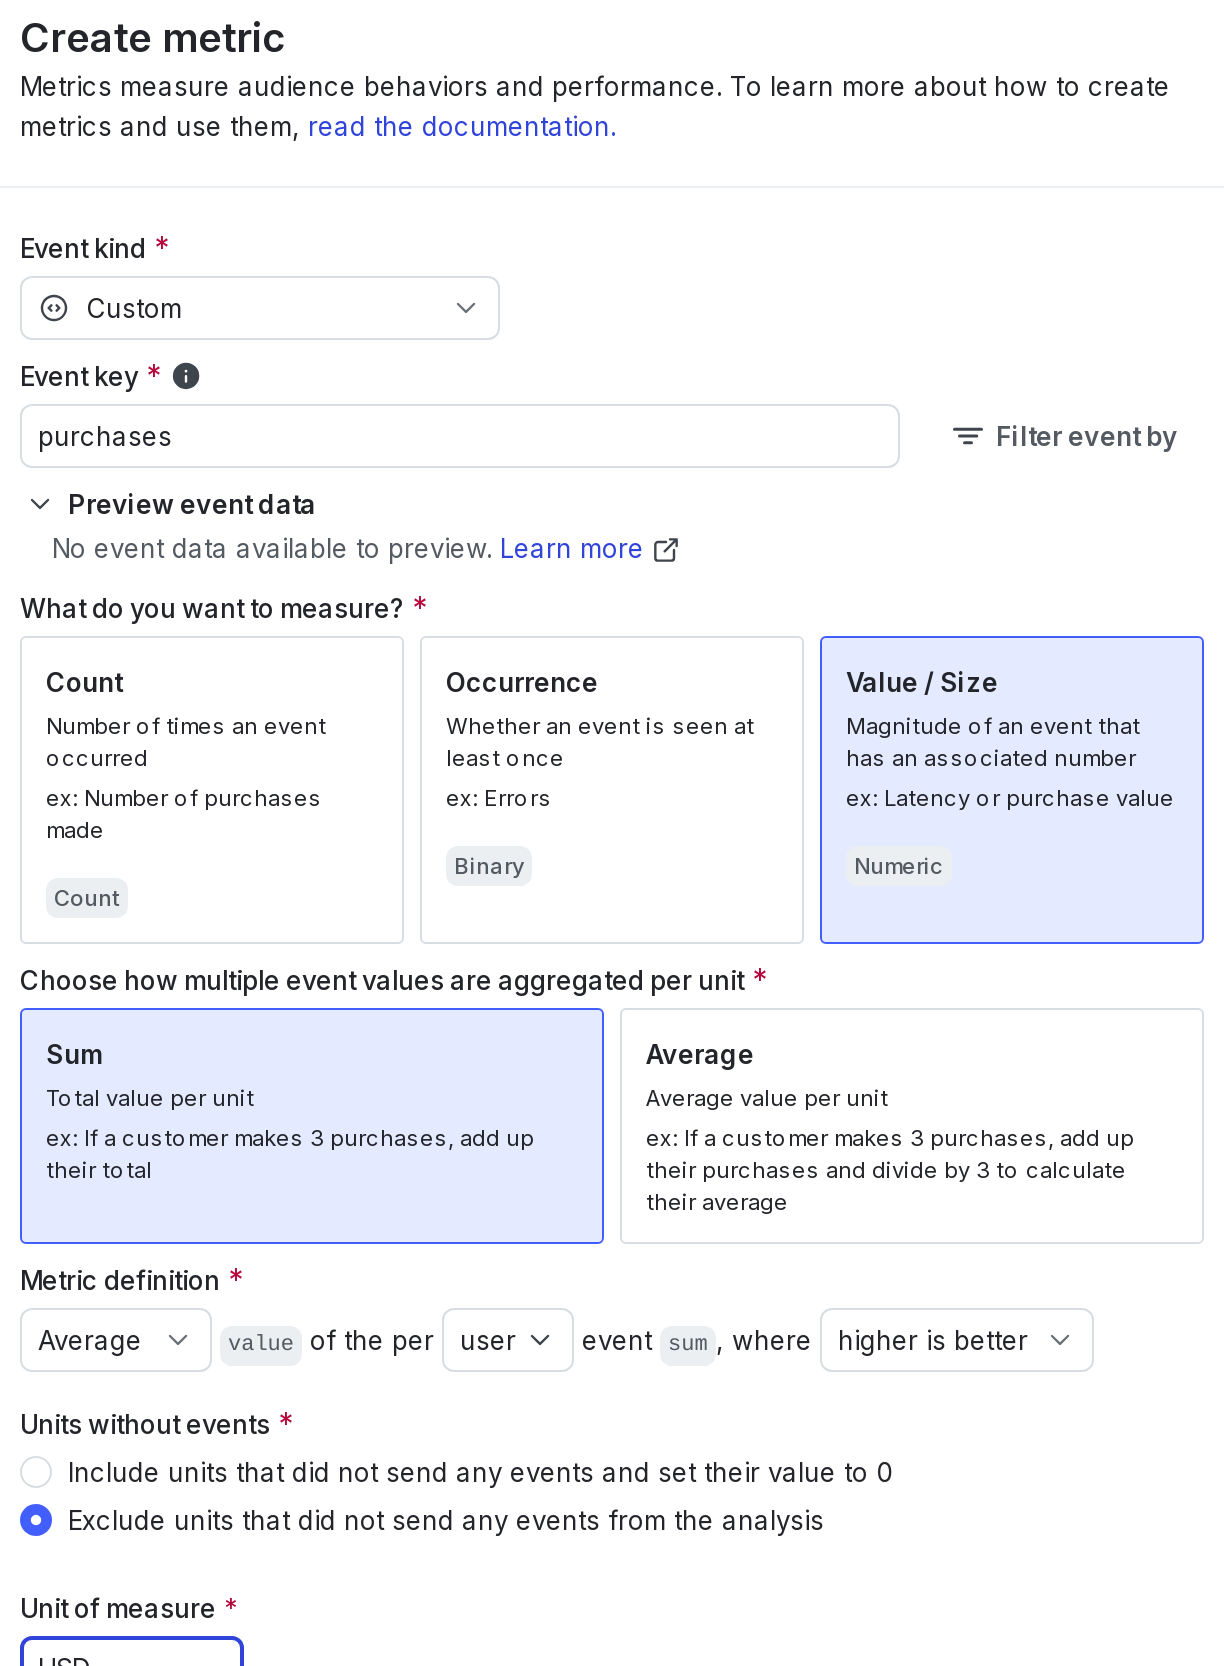 Here is an example of how the metric calculates its results:| Step 1| Step 2
| ---| --- |
| Users made the following purchases: * User A: 300 * User B: $10 * User C: $7 * User D: $0 (no purchases)| The metric calculates the sum for each user, excluding those who didn’t purchase anything: * User A: $400 * User B: $10 * User C: $7| The metric then calculates the average sum: * Result: $139 |
- Event kind: Custom
- What do you want to measure: Value/size
- How multiple event values are aggregated per unit: Sum
- Analysis method: Average
- Randomization unit: User
- Success criterion: Higher is better
- Units without events: Exclude units that did not send any events from the analysis
- Unit of measure: USD
| Step 3 |
|---|
Average revenue per user: all users
Expand Average revenue per user: all users
Expand Average revenue per user: all users
This custom numeric metric sums purchase amounts per user, instead of calculating average amounts per purchase. This lets you find out about the purchasing behavior of users as a whole, ignoring whether the money they spent was all at once or spread between multiple purchases. This includes users who didn’t purchase anything.The metric configuration options include: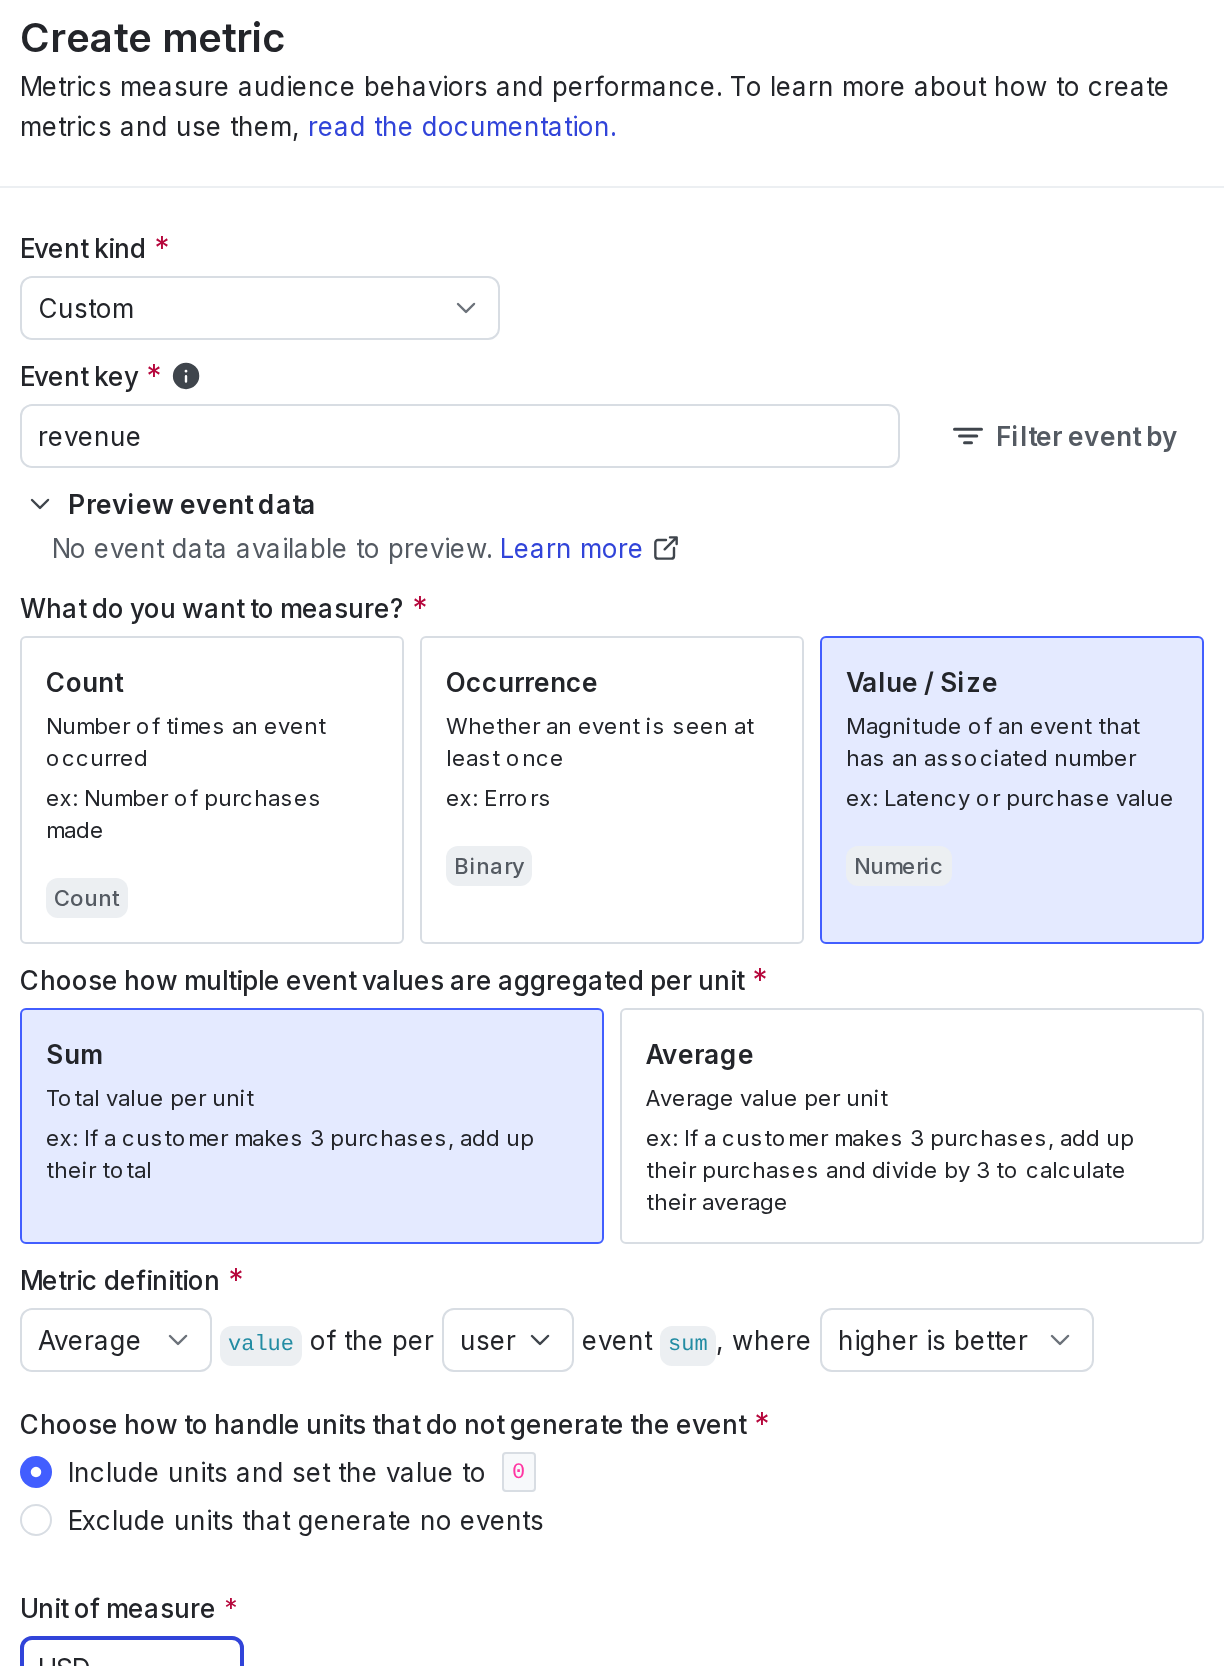 Here is an example of how the metric calculates its results:| Step 1| Step 2
| ---| --- |
| Users made the following purchases: * User A: 300 * User B: $10 * User C: $7 * User D: $0 (no purchases)| The metric calculates the sum for each user, including those who didn’t purchase anything: * User A: $400 * User B: $10 * User C: $7 * User D: $0| The metric then calculates the average sum: * Result: $104.25 |
- Event kind: Custom
- What do you want to measure: Value/size
- How multiple event values are aggregated per unit: Sum
- Analysis method: Average
- Randomization unit: User
- Success criterion: Higher is better
- Units without events: Include units that did not send any events and set their value to 0
- Unit of measure: USD
| Step 3 |
|---|
Example: average number of purchases
This section includes the configuration options for common custom conversion binary metrics related to average number of purchases. For the example in this section, the randomization unit is “user.”Average number of purchases: per user who purchased
Expand Average number of purchases: per user who purchased
Expand Average number of purchases: per user who purchased
You can use this custom conversion binary metric to learn the average number of purchases for users who made a purchase.The metric configuration options include: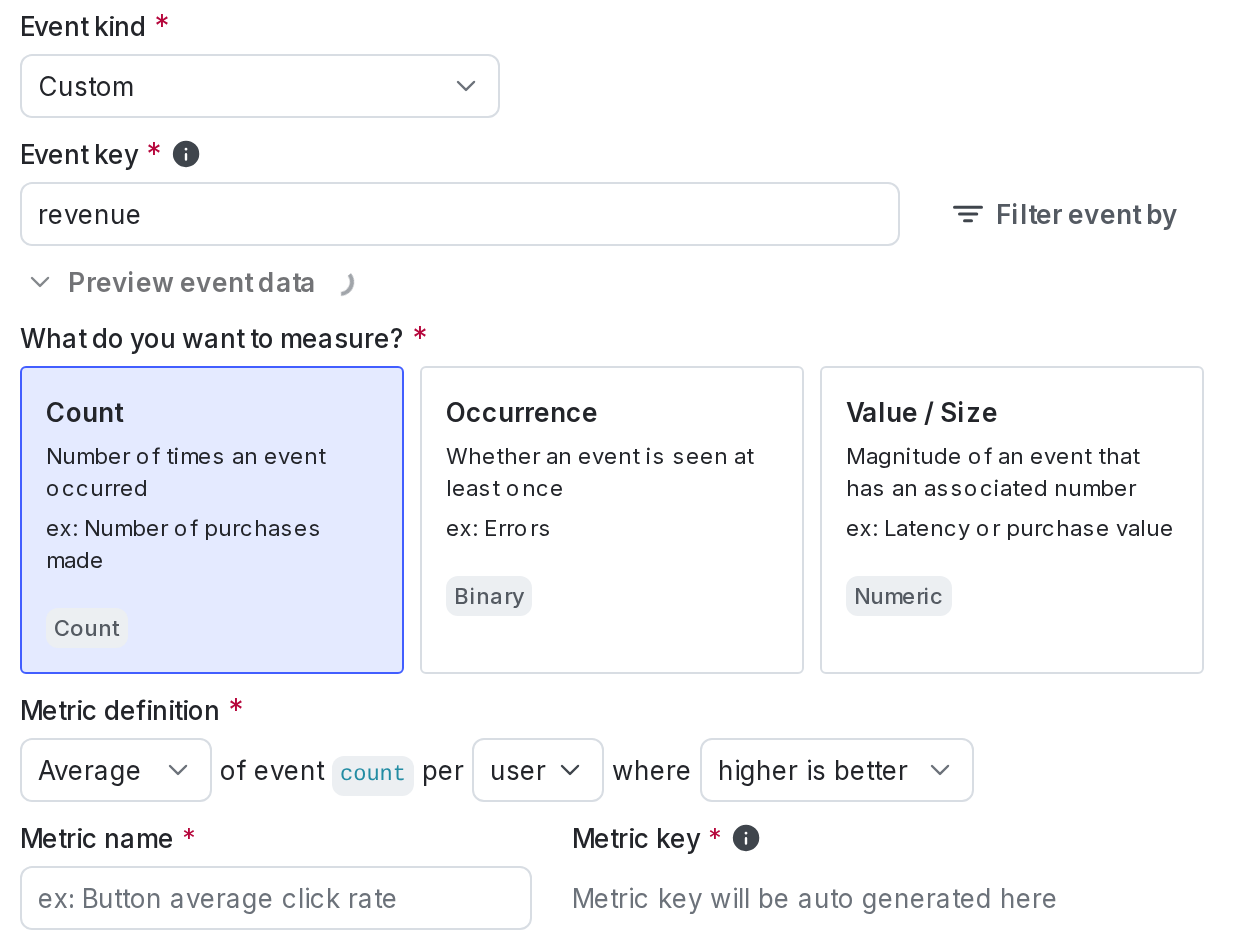 Here is an example of how the metric calculates its results:| Step 1| Step 2
| ---| --- |
| Users made the following purchases: * User A: 1 purchase, 1 purchase * User B: 1 purchase * User C: 1 purchase * User D: 0 purchases| The metric calculates the sum for each user, excluding those who didn’t purchase anything: * User A: 2 * User B: 1 * User C: 1| The metric then calculates the average sum: * Result: 1.33 |
- Event kind: Custom
- What do you want to measure: Count
- Analysis method: Average
- Randomization unit: User
- Success criterion: Higher is better
| Step 3 |
|---|
Example: latency
This section includes the configuration options for common custom numeric metrics related to latency time. For the example in this section, the randomization unit is “request.”Latency excluding the slowest 1% of results
Expand Latency excluding the slowest 1% of results
Expand Latency excluding the slowest 1% of results
This custom numeric metric calculates latency, excluding the slowest 1% of requests that may skew the data. When using a percentile analysis method, LaunchDarkly automatically excludes units without events.The metric configuration options include: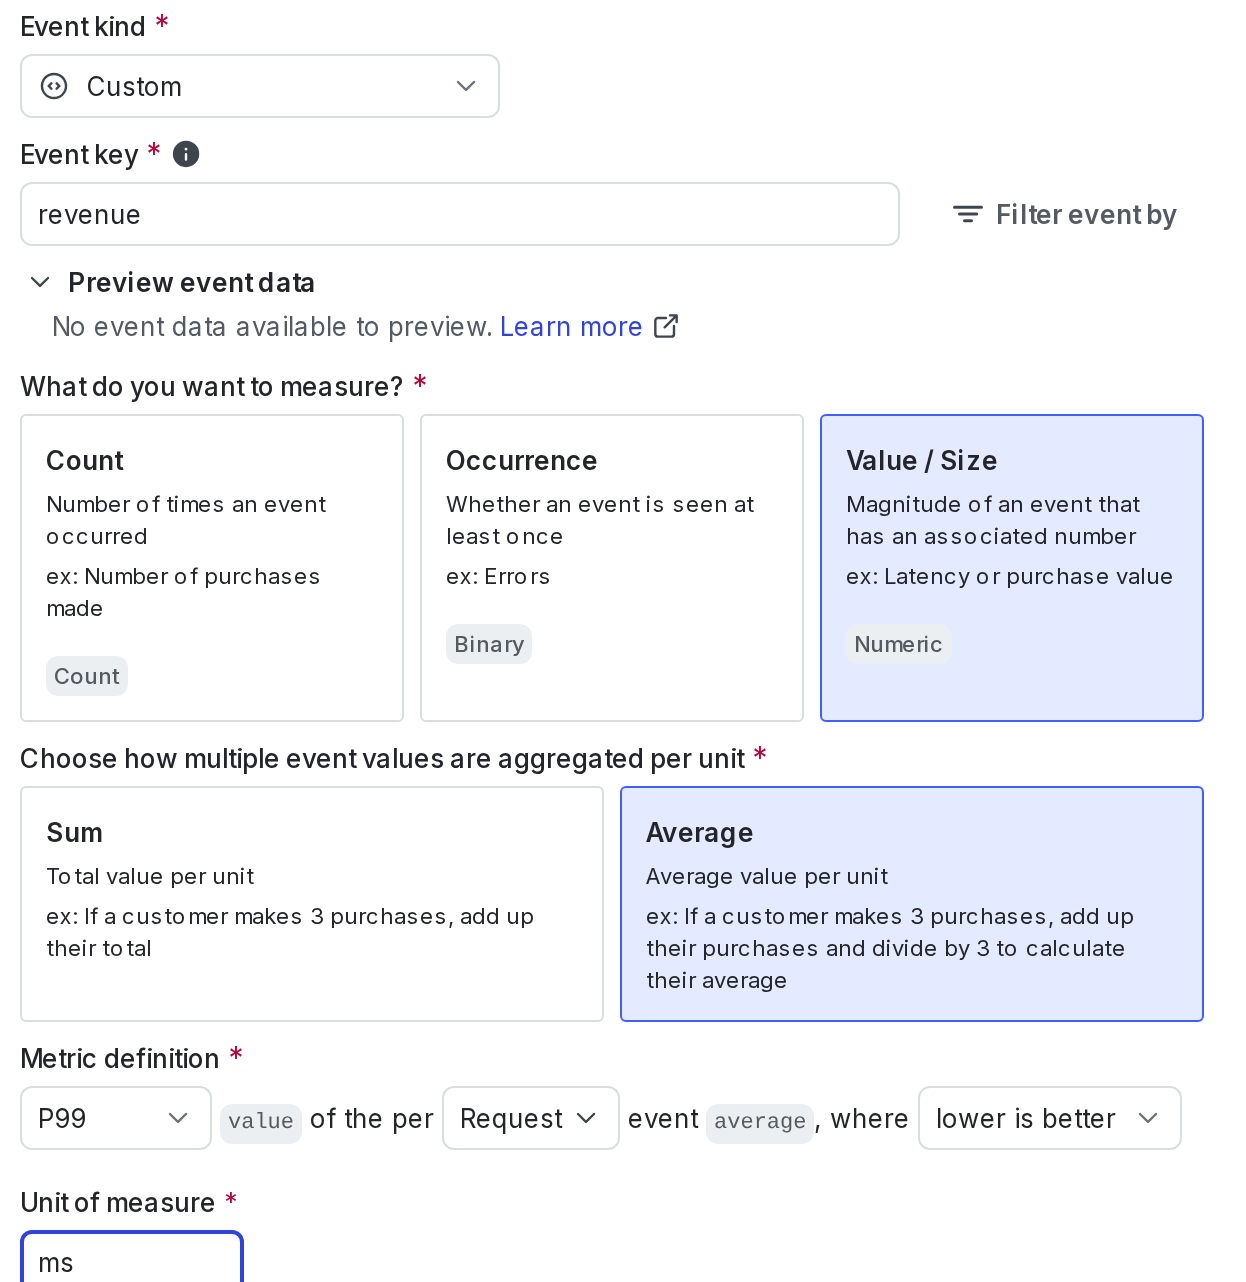 Here is an example of how the metric calculates its results:| Step 1
| --- |
| Requests had the following latency: * Request A: 20ms * Request B: 10ms * Request C: 70ms * Request D: 30ms| The metric then calculates the 99th percentile: * Result: 70ms |This means that 99% of requests, on average, have a latency of less than 70ms.
- Event kind: Custom
- What do you want to measure: Value/size
- How multiple event values are aggregated per unit: Average
- Analysis method: P99
- Randomization unit: Request
- Success criterion: Lower is better
- Unit of measure: ms
| Step 2 |
|---|