Documentation Index
Fetch the complete documentation index at: https://launchdarkly-preview.mintlify.app/llms.txt
Use this file to discover all available pages before exploring further.
Overview
This topic explains how to use feature monitoring to evaluate the performance of a feature flag. Feature monitoring gives you visibility into whether a newly-released flag variation is having any negative impacts on user experience by monitoring front-end LaunchDarkly metrics, including front-end errors, Largest Contentful Paint, Interaction to Next Paint, and Cumulative Layout Shift. This functionality is available through an observability plugin to LaunchDarkly client-side SDKs. You can enable these when you initialize the LaunchDarkly client in your app. To learn how, read about LaunchDarkly’s Observability SDKs. To learn how to view information about flag evaluations, read Flag evaluations. To learn how to view incoming flag events, read Live events.Feature monitoring charts
To view feature monitoring charts, navigate to the “System-wide” section of a flag’s Monitoring tab: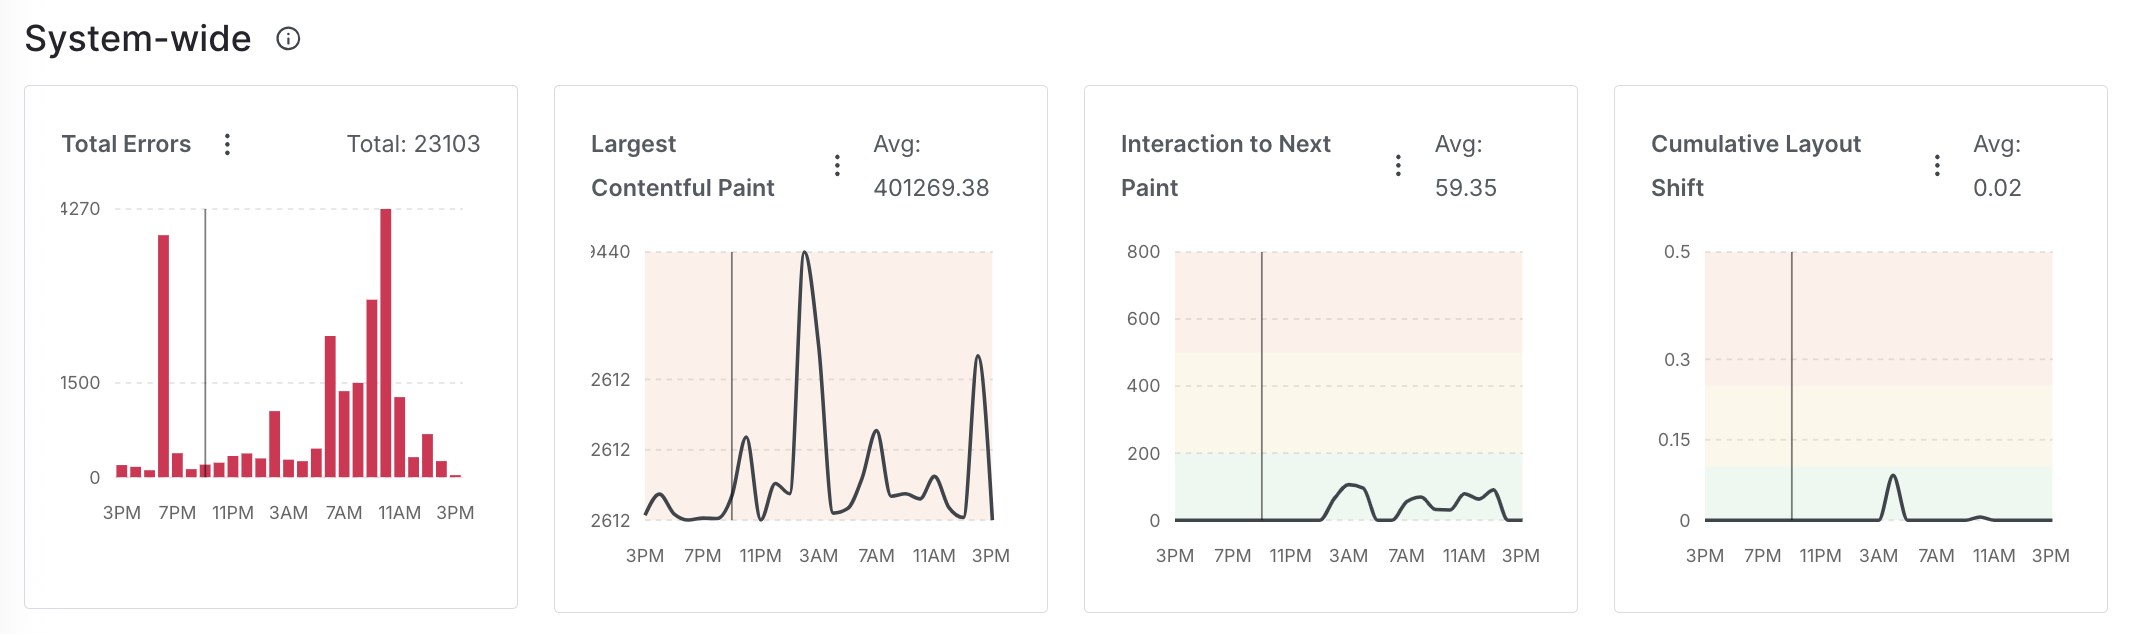
Total errors
Total errors measures the number of front-end errors users encountered in your app. The event key is$ld:telemetry:error.
Largest Contentful Paint
The Largest Contentful Paint (LCP), Interaction to Next Paint (INP), and Cumulative Layout Shift (CLS) charts are available to customers on a Guardian plan. To learn more, read about our pricing. To upgrade your plan, contact Sales.
$ld:telemetry:metric:lcp.
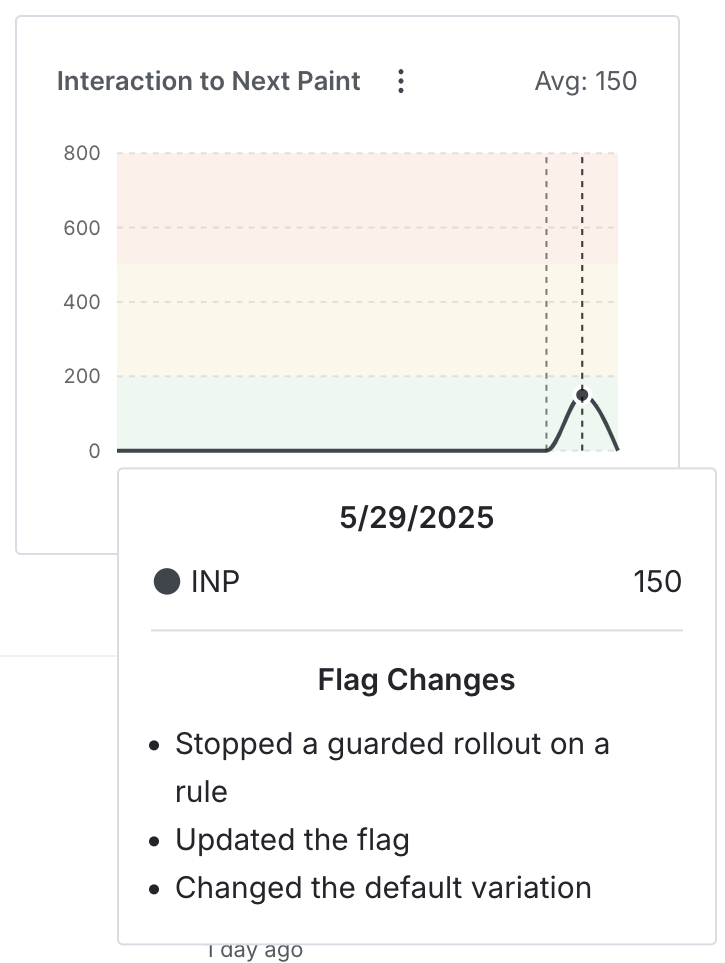
Interaction to Next Paint
Interaction to Next Paint (INP) measures how quickly a website responds to user interactions. It uses the “Average Interaction to Next Paint (INP) per context (LaunchDarkly)” metric autogenerated from observability events. The event key is$ld:telemetry:metric:inp.
Cumulative Layout Shift
Cumulative Layout Shift (CLS) measures how much content on a page shifts unexpectedly while loading. It uses the “Average Cumulative Layout Shift (CLS) per context (LaunchDarkly)” metric autogenerated from observability events. The event key is$ld:telemetry:metric:cls.
Share feature monitoring charts
To share a direct link to a chart, click the three-dot overflow menu and select “Copy link”: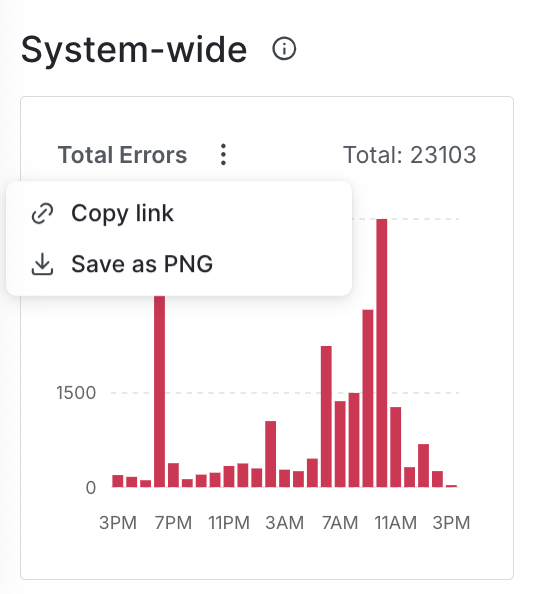
.png version of a chart, click the three-dot overflow menu and select “Save as PNG.”