Published June 6, 2024
 [](https://youtube.com/live/z9g-eOPwndk)
## What is Distributed Tracing?
Distributed tracing allows us to understand the performance and monitor the execution of complex distributed applications that span multiple services. It links operations across services together into a single trace, making it easier to identify bottlenecks and debug issues.
## Installing the Launch
Darkly SDK
To instrument distributed tracing in Next.js, you first need to add the LaunchDarkly SDK to your Next.js client code. This automatically injects trace headers into outgoing requests from the browser.
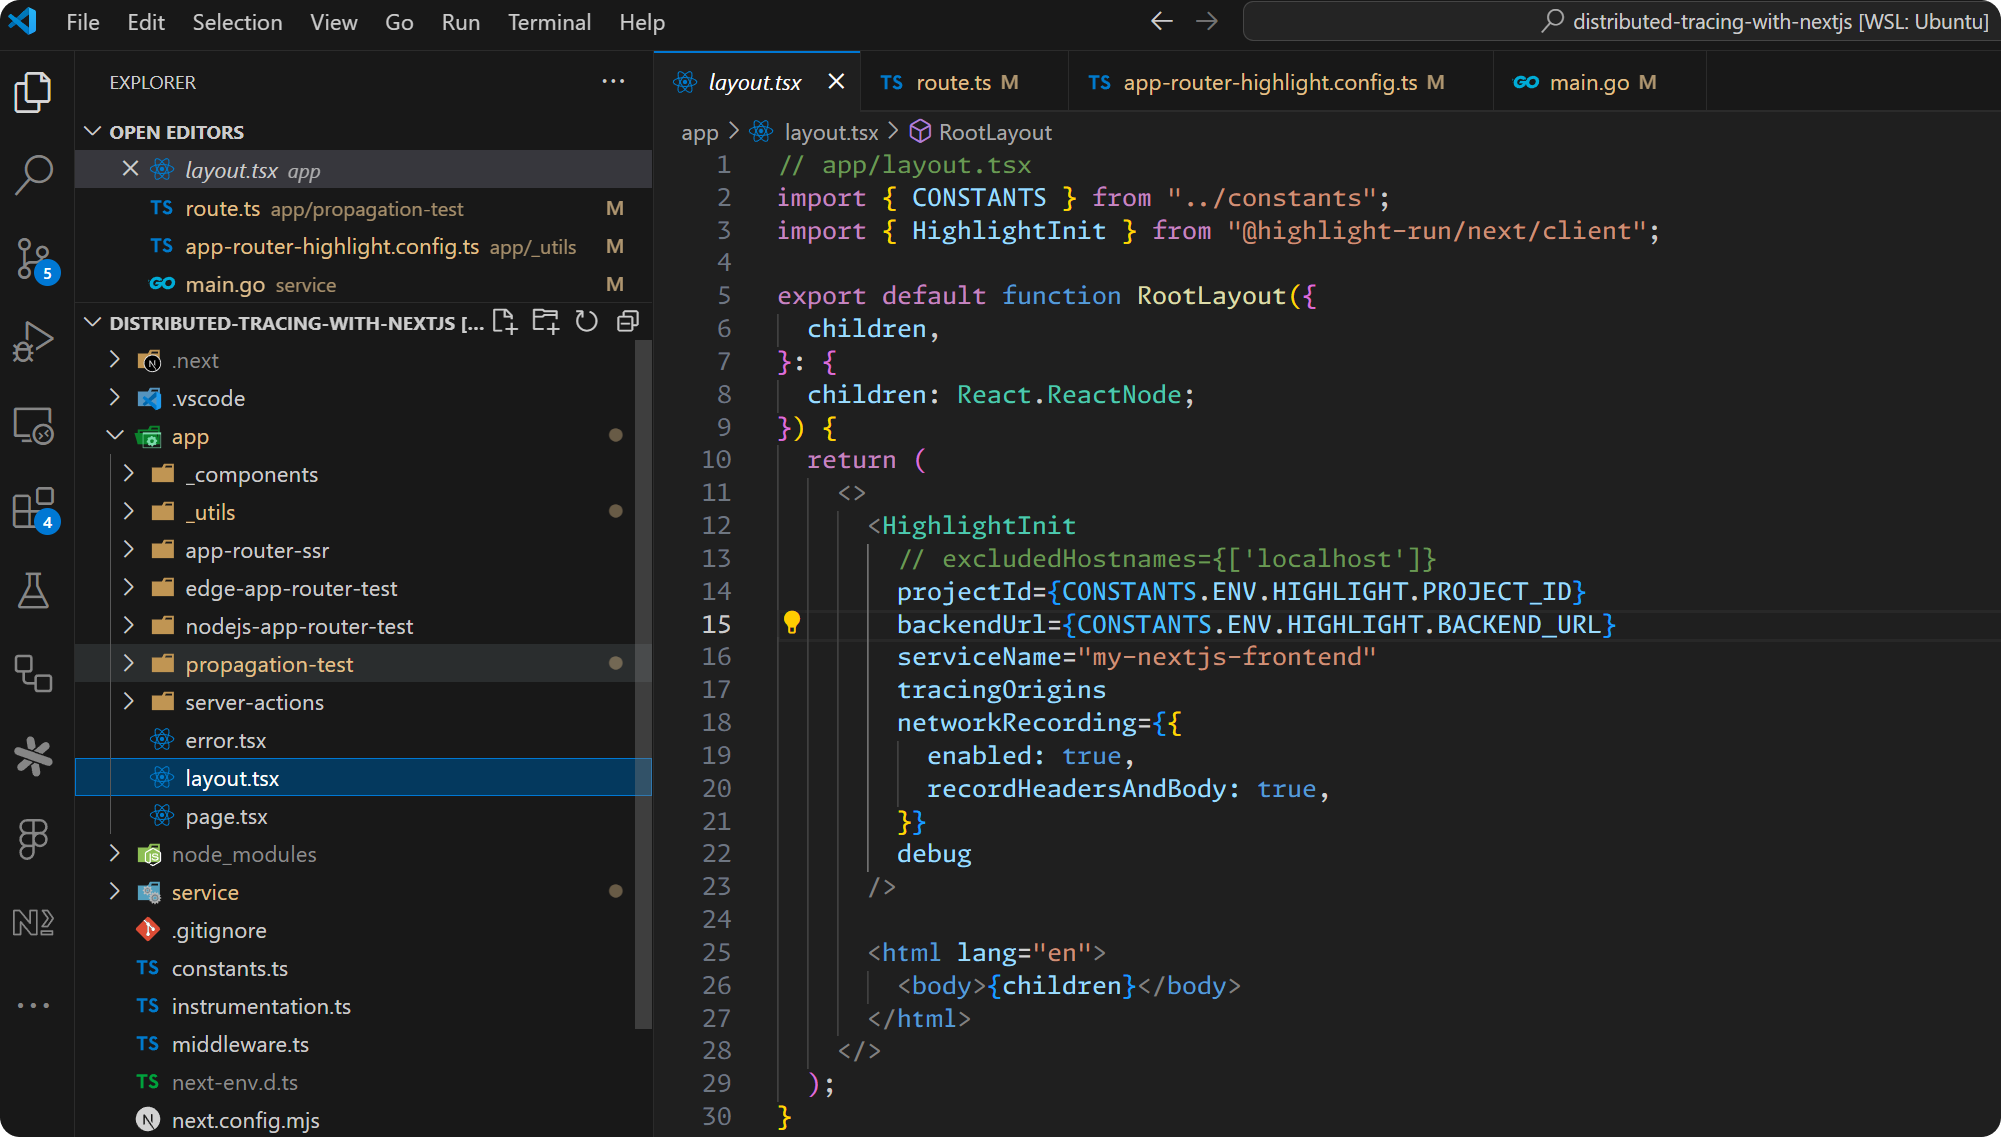
On the server-side Next.js code, you use middleware to extract the incoming trace headers and propagate them via W3C trace context headers to any downstream service calls made by your API routes. These context headers contain a unique trace ID as well as details on parent/child relationships between operations.
Any downstream services, such as a Go microservice, can then implement middleware to extract the incoming trace context headers. This allows them to associate their operations with the correct trace, while still having the flexibility to start new nested spans for particular code blocks.
## Visualize Traces Across Your Entire Service Stack
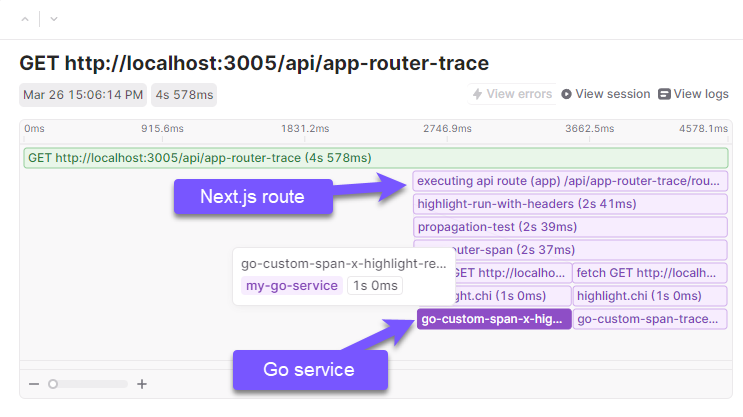
With this distributed tracing setup, you can collect end-to-end traces spanning the client, Next.js backend, and all microservices. A tool like LaunchDarkly is critical for collecting and visualizing these traces. The waterfall visualization clearly shows the timing of each operation and their parent/child relationships, making it easy to pinpoint performance issues across services.
As open source standards, the W3C trace context propagation headers used in this approach will work with any observability vendor's tracing tools. However, the Open Telemetry project takes an even more vendor-neutral approach that can simplify instrumentation further.
[](https://youtube.com/live/z9g-eOPwndk)
## What is Distributed Tracing?
Distributed tracing allows us to understand the performance and monitor the execution of complex distributed applications that span multiple services. It links operations across services together into a single trace, making it easier to identify bottlenecks and debug issues.
## Installing the Launch
Darkly SDK
To instrument distributed tracing in Next.js, you first need to add the LaunchDarkly SDK to your Next.js client code. This automatically injects trace headers into outgoing requests from the browser.

On the server-side Next.js code, you use middleware to extract the incoming trace headers and propagate them via W3C trace context headers to any downstream service calls made by your API routes. These context headers contain a unique trace ID as well as details on parent/child relationships between operations.
Any downstream services, such as a Go microservice, can then implement middleware to extract the incoming trace context headers. This allows them to associate their operations with the correct trace, while still having the flexibility to start new nested spans for particular code blocks.
## Visualize Traces Across Your Entire Service Stack
With this distributed tracing setup, you can collect end-to-end traces spanning the client, Next.js backend, and all microservices. A tool like LaunchDarkly is critical for collecting and visualizing these traces. The waterfall visualization clearly shows the timing of each operation and their parent/child relationships, making it easy to pinpoint performance issues across services.

As open source standards, the W3C trace context propagation headers used in this approach will work with any observability vendor's tracing tools. However, the Open Telemetry project takes an even more vendor-neutral approach that can simplify instrumentation further.