> ## Documentation Index
> Fetch the complete documentation index at: https://launchdarkly-preview.mintlify.site/llms.txt
> Use this file to discover all available pages before exploring further.
# Elastic (ELK) Stack
> This topic explains how to use the LaunchDarkly Elastic (ELK) Stack integration. The Elastic Stack, formerly referred to as the ELK stack, is a search platform used widely as an observability and security platform.
> For the complete documentation index, see [llms.txt](/llms.txt). For the full documentation snapshot, see [llms-full.txt](/llms-full.txt).
The Elastic Stack integration is only available to customers on select plans. To learn more, [read about our pricing](https://launchdarkly.com/pricing/). To upgrade your plan, [contact Sales](https://launchdarkly.com/contact-sales/).
## Overview
This topic explains how to use the LaunchDarkly Elastic (ELK) Stack integration. [The Elastic Stack](https://www.elastic.co/), which is also referred to as the [ELK Stack](https://www.elastic.co/elastic-stack/), is a versatile search platform with many use cases, from site and application search to observability and security.
LaunchDarkly's Elastic Stack integration supports log aggregation and data and timeseries visualization.
For example, an engineer is alerted to an anomaly in their application's behavior. With the LaunchDarkly Elastic Stack integration sending data to their observability stack, they can easily correlate flag changes atop timeseries and understand what changes happened just before the anomalous activity.
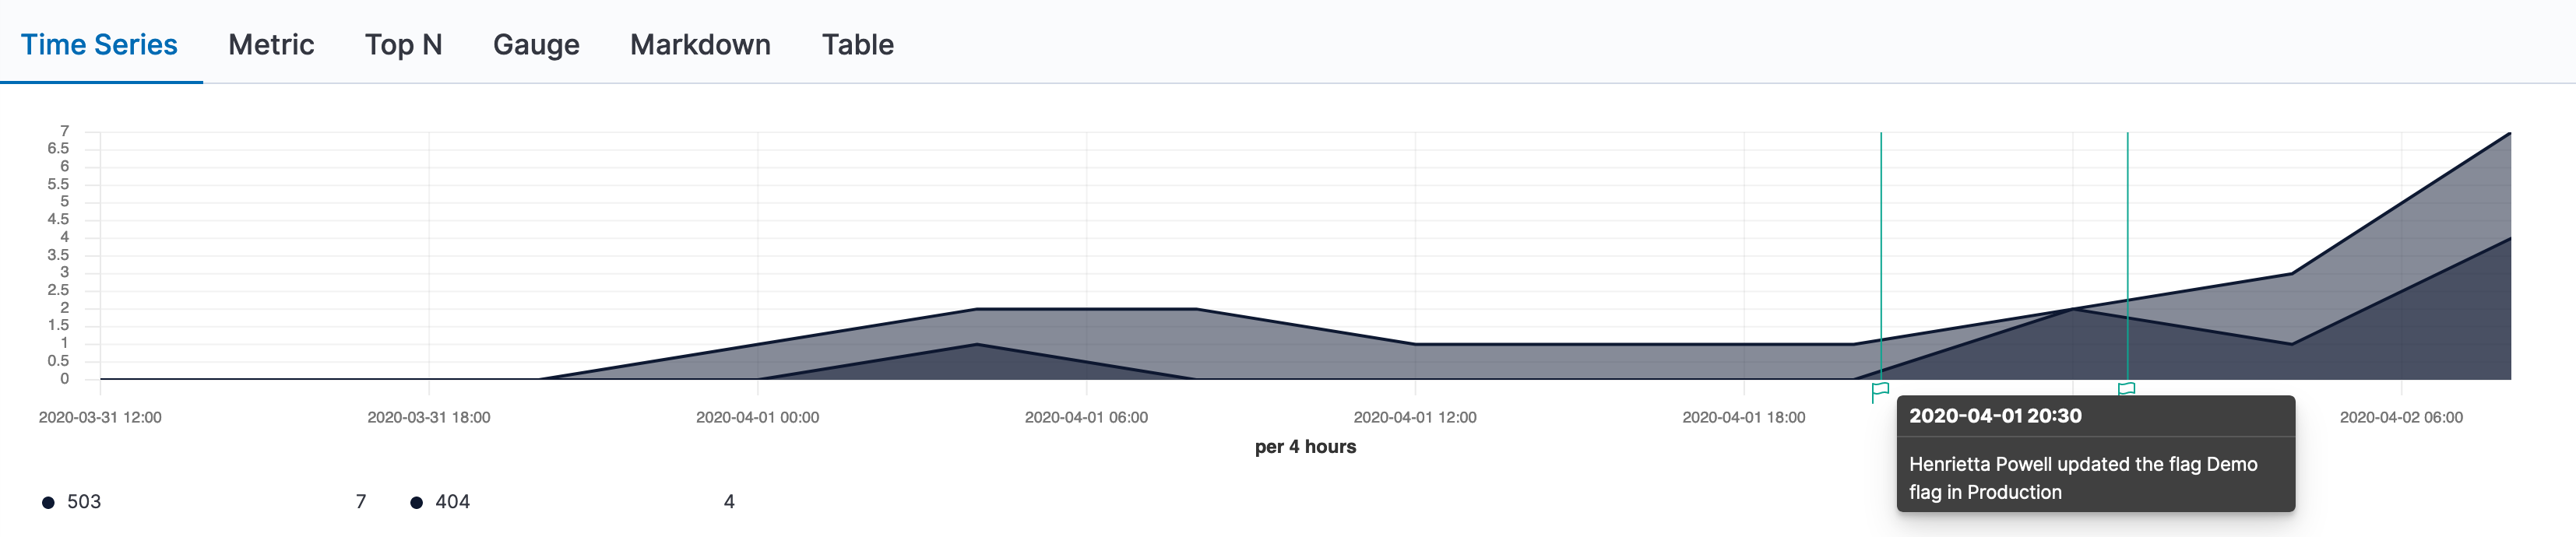
Development teams could also build data visualizations around their LaunchDarkly change history data to find out more about who interacts with or modifies their feature flags. You can even use Elasticsearch to find specific information in your logs.
## Prerequisites
To configure the Elastic integration, you must have the following prerequisites:
* **Your Elasticsearch endpoint URL**: This is the destination to which LaunchDarkly sends its data. It must include the socket number. If you are using the Elastic Search Service from Elastic Cloud, you can find your endpoint URL by clicking your deployment name and selecting **Copy Endpoint URL** just below the Elasticsearch logo.
* **API Key credentials**: To learn more about getting an API key, read [Elastic's API Key Documentation](https://www.elastic.co/guide/en/elasticsearch/reference/7.10/security-api-create-api-key.html). Ensure this key gives permission to write to the appropriate Elasticsearch index.
* **Elasticsearch index**: The Elasticsearch index indicates which index the LaunchDarkly data should be written to in your cluster. You can use the default or choose your own.
## Configure the Elastic Stack integration
Here's how to configure the Elastic Stack integration:
1. Click the **gear** icon in the left sidenav to view Organization settings.
2. Click **Integrations** and find "Elastic (ELK) Stack."
3. Click **Add integration**. The "Create Elastic (ELK) Stack configuration" panel appears.
4. (Optional) Enter a human-readable **Name**.
5. Paste in the **Elasticsearch endpoint URL**.
6. Paste in the **Authentication token**. This is the base64 encoding of `id` and `api_key`, joined by a colon.
7. Enter or use the default value for the **Index** to which you want to write your LaunchDarkly data.
8. (Optional) Configure a custom policy to control which information LaunchDarkly sends to your Elastic cluster. To learn more, read [Choose what data to send](#choose-what-data-to-send).
9. After reading the Integration Terms and Conditions, check the **I have read and agree to the Integration Terms and Conditions** checkbox.
10. Click **Save configuration**.
After you configure the integration, LaunchDarkly sends flag, environment, and project data to your Elastic cluster.
## Choose what data to send
The "Policy" configuration field allows you to control which kinds of LaunchDarkly events are sent to Elasticsearch. The default policy value restricts it to flag changes in production environments:
```txt title="Policy example" theme={null}
proj/*:env/production:flag/*
```
You may want to override the default policy if you wanting to restrict the integration to a specific combination of LaunchDarkly projects and environments or to a specific action or set of actions.
In the example below, the policy restricts LaunchDarkly to only send changes from the `web-app` project's production environment to Elasticsearch:
```txt title="Policy example" theme={null}
proj/web-app:env/production:flag/*
```
### Example payload
Expand the section below to view an example payload of LaunchDarkly data to Elastic Stack.
```js title="Example payload" theme={null}
{
"date": "2024-06-12T13:59:55Z",
"event": {
"kind": "flag",
"action": "updateFallthrough"
},
"tags": "pricing-and-packaging",
"target": {
"name": "Pricing tier 3",
"key": "pricing-tier-3",
"link": "https://app.launchdarkly.com/the-big-project/production/features/pricing-tier-3"
},
"project": {
"name": "Mobile app",
"key": "mobile-app",
"tags": ""
},
"environment": {
"name": "Production",
"key": "production",
"tags": ""
},
"user": {
"id": "12ab3c45de678910abc12345",
"email": "sandy@example.com",
"name": {
"first": "Sandy",
"last": "Smith",
"full": "Sandy Smith"
},
"link": "https://app.launchdarkly.com/api/v2/members/abc123"
},
"message": "Sandy Smith updated the flag Pricing tier 3 in 'Production'",
"details": "Increased the default rollout from '33%' to '45%'",
"comment": "Increasing the percentage rollout"
}
```
### Send more data to Elasticsearch
Alternatively, you use the integration to monitor not just flag changes, but all environment and project changes. If you want to send absolutely everything to Elasticsearch, you must add policies for project and environment data:
To send more data to Elasticsearch:
1. Navigate to the **Integrations** page and find the integration you wish to modify.
2. Find your Elastic (ELK) Stack integration. Click the **three-dot** overflow menu and select **Edit integration configuration**. The "Edit Elastic (ELK) Stack configuration" panel appears.
3. In the "Edit policy" section, click **+ Add statement**.
4. Use the menus to set the scope and actions for the statement. Alternatively, click **View JSON** and enter a statement for the resources you would like to send to Elasticsearch. For example, `proj/*` will send all project data and `proj/*:env/*` will send all environment data from all projects.
5. Repeat steps 3 and 4 for each additional category of data you'd like to send to Elasticsearch.
6. When you've added all the policies you wish, click **Save configuration**.
To learn more about setting policies, read [Using policies](/home/account/roles/role-policies).
## Use the integration with Kibana
Kibana is a front-end application that provides search and data visualization for data indexed in Elasticsearch.
After you configure the Elastic (ELK) Stack integration, your LaunchDarkly data streams to Elasticsearch and becomes available for searching. You can use Kibana to visualize the data Elastic (ESK) Stack receives.
You must configure your Kibana instance to retrieve this data and display it in its own visualizations or annotate your existing timeseries charts.
To make data available to Kibana, you must create a new **index pattern**:
1. Log into your Kibana instance.
2. Navigate to **Settings** in the left-hand navigation by clicking on the **gear** icon.
3. Under Kibana, select **Index Patterns**.
4. Click **Create Index Pattern**.
5. Enter the appropriate pattern to refer to your LaunchDarkly index or indices. If you used the default value, `launchdarkly-audit` will match specifically that new index. Wildcards are supported, so you may want to end your pattern with `*` to support feature log index cycling.
6. Choose `date` for the **Time Filter field name**.
7. Click **Create index pattern**.
8. Verify your data appears correctly by using the **Discover** section of Kibana and selecting your new index pattern.
Now you can use your LaunchDarkly data alongside everything else in Kibana.
## Other resources
You can continue reading Elastic's documentation to learn more about these products:
* To learn more about visualizations in Kibana, read [Kibana's documentation](https://www.elastic.co/guide/en/kibana/7.10/monitoring-data.html).
* To learn more about index patterns, read the [Elastic Kibana guide](https://www.elastic.co/guide/en/kibana/7.10/index-patterns.html).