> ## Documentation Index
> Fetch the complete documentation index at: https://launchdarkly-preview.mintlify.site/llms.txt
> Use this file to discover all available pages before exploring further.
# Observability settings
> This topic describes the project-level settings available for sessions, errors, logs, and traces.
> For the complete documentation index, see [llms.txt](/llms.txt). For the full documentation snapshot, see [llms-full.txt](/llms-full.txt).
## Overview
This topic describes the project-level settings available for sessions, errors, logs, and traces.
In the left navigation of the LaunchDarkly UI, expand **Observe** to view them.
To view or update project-level settings for these features:
1. Click the project dropdown to open the project menu.
2. Select **Project settings**.
3. Click **Observability**. The Observability settings page appears.
The following sections describe the available settings.
## Session settings
You can configure the following settings for sessions in your project:
* **Excluded users**. This setting excludes sessions from particular end users, based on their context key or email address.
* **Rage clicks**. These settings adjust the sensitivity for detecting "rage clicks," or occasions when end users repeatedly click an element in your application, indicating frustration. You can set the **Elapsed time**, **Radius**, and **Minimum clicks**. These settings control whether a search for session replays that uses the `has_rage_clicks` attribute will return a given session. By default, LaunchDarkly considers end-user activity a rage click when there exists a two-second or longer period in which an end user clicks five or more times within a radius of eight pixels.
Click **Save** to save your settings.
## Error settings
You can configure the following settings for errors in your project:
* **Sourcemaps**. If you have [uploaded sourcemaps](/sdk/features/observability-errors#viewing-errors-and-sourcemaps), you can view them here.
* **Auto-resolve stale errors**. When enabled, this setting automatically sets the status of an error to "Resolved" after the time period you select.
Click **Save** to save your settings.
## Filters
Filters help you manage the ingestion of sessions, errors, logs, or traces that you send to LaunchDarkly. This is useful if you know certain signals which are not relevant to your application or are not actionable. Any excluded signals do not count against your observability quotas.
To configure ingestion filters:
1. Navigate to the Observability project settings page.
2. From the **Filters** section, click **Edit** next to the type of signal you want to configure.
3. (Optional) Configure filter **rules** to manage ingestion of sessions, errors, logs, or traces.
4. (Optional) Set the **Max ingest per minute**. This setting rate limits the maximum number of data points ingested in a one-minute window. For example, you may configure a rate limit of 100 per minute. This lets you limit the number of data points recorded in case of a significant spike in use of your application.
5. Click **Save**.
Rules are evaluated in order, from top to bottom. Drag and drop the rules to reorder them to fit your project's needs. The first **enabled** rule that matches the criteria applies its filter operation and rate.
### Rules
To add a filter rule:
1. Click **Add rule**.
2. Set a rule name.
3. Review the filter rule operation. Exclusion rules are used for sessions, errors, and logs. Inclusion rules are used for traces. You cannot change these settings.
4. Set a query:
* Click the **Filter...** placeholder and select an attribute from the dropdown. For example, you can filter sessions based on `active_length`.
* For details on the available attributes, read [Search attributes for session replay](/home/observability/session-replay#search-attribute-reference), [Search attributes for errors](/home/observability/errors#search-attributes), [Search attributes for logs](/home/observability/logs#search-attributes), and [Search attributes for traces](/home/observability/traces#search-attributes).
* Select an operator from the dropdown. For example, you can filter by greater than, `>`.
* Enter a value for your expression. For example, you can enter `8s` for eight seconds.
5. Set the rules **rate** (%). For each signal that LaunchDarkly receives, it makes a randomized decision according to the rules rate whether to apply the `include` or `exclude` filter operation.
* For example, if an exclusion rule has a 20% rate, then 20% of the signals that match the rule's query are excluded and the remaining 80% are included.
6. Set the rule **On** or **Off** to enable or disable the rule.
7. Click **Save**.
If a signal does not match any rules query, then it is included by LaunchDarkly.
Here is an example of multiple log filter rules:
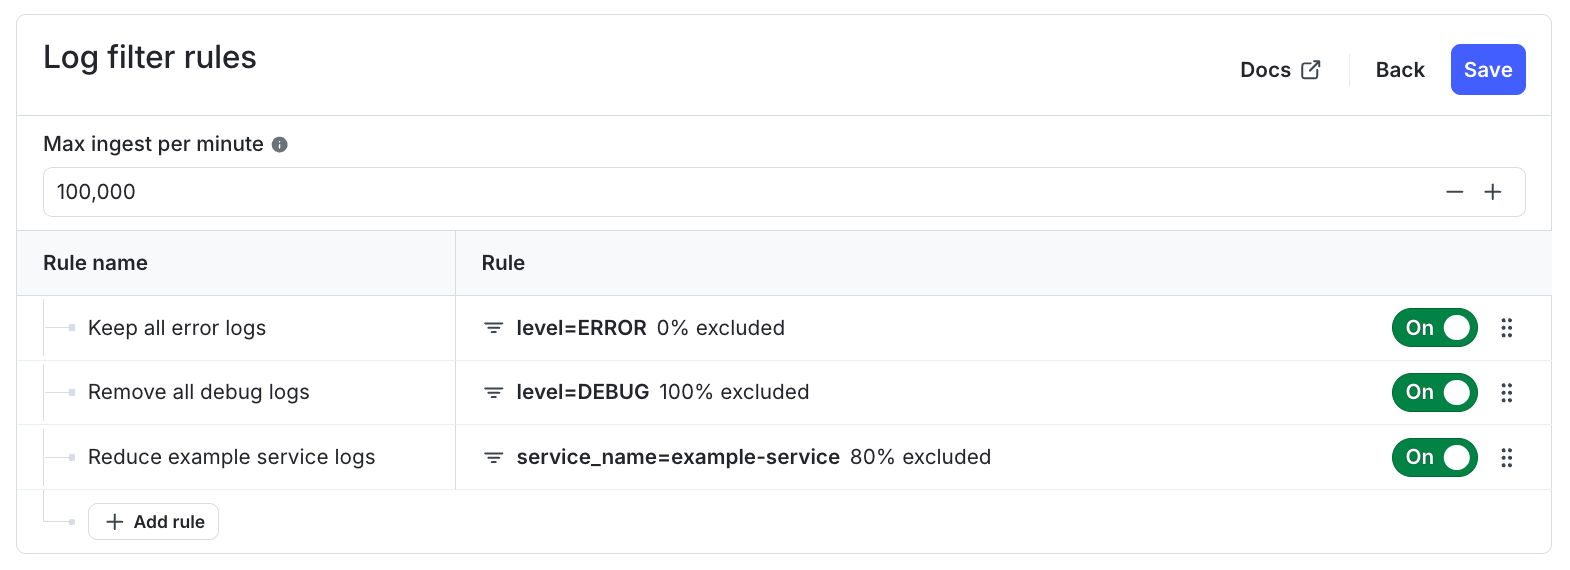
Here is how rule order controls rule evaluation:
* Logs with `level=ERROR` and `service_name=example-service` are always included, the first rule matches, therefore the second and third rule are not reached.
* Logs with `level=DEBUG` and `service_name=example-service` are always excluded, the first rule is skipped, the second rule matches, therefore the third rule is not reached.
* Logs with `level=INFO` and `service_name=example-service` are 80% excluded and 20% included, the first and second rule are skipped, and the third rule matches.
* Logs with `level=INFO` and `service_name=new-service` are always included, all three rules are skipped, therefore the log is ingested.