> ## Documentation Index
> Fetch the complete documentation index at: https://launchdarkly-preview.mintlify.site/llms.txt
> Use this file to discover all available pages before exploring further.
# Multi-armed bandit results
> This topic explains how to read the results of a multi-armed bandit.
> For the complete documentation index, see [llms.txt](/llms.txt). For the full documentation snapshot, see [llms-full.txt](/llms-full.txt).
## Overview
This topic explains how to read the results of a multi-armed bandit (MAB). MABs automatically shift traffic to the leading variation over time, so you do not need to actively monitor a MAB, and you do not need to manually ship the leading variation. However, you can still use the **Results** tab to view the performance of each variation, and understand how the MAB is reallocating traffic.
You can run a MAB indefinitely, allowing it to reallocate traffic as needed. If you don't want to run a MAB indefinitely, we recommend that you stop it when a single variation's probability to be best reaches 99% or higher.
If you are running a MAB on a time-boxed feature, such as a holiday promotion, then you can stop the MAB iteration when the promotion is over.
## Summary
The "Summary" section displays the MAB's optimization goal and key takeaways.
## Cumulative exposures
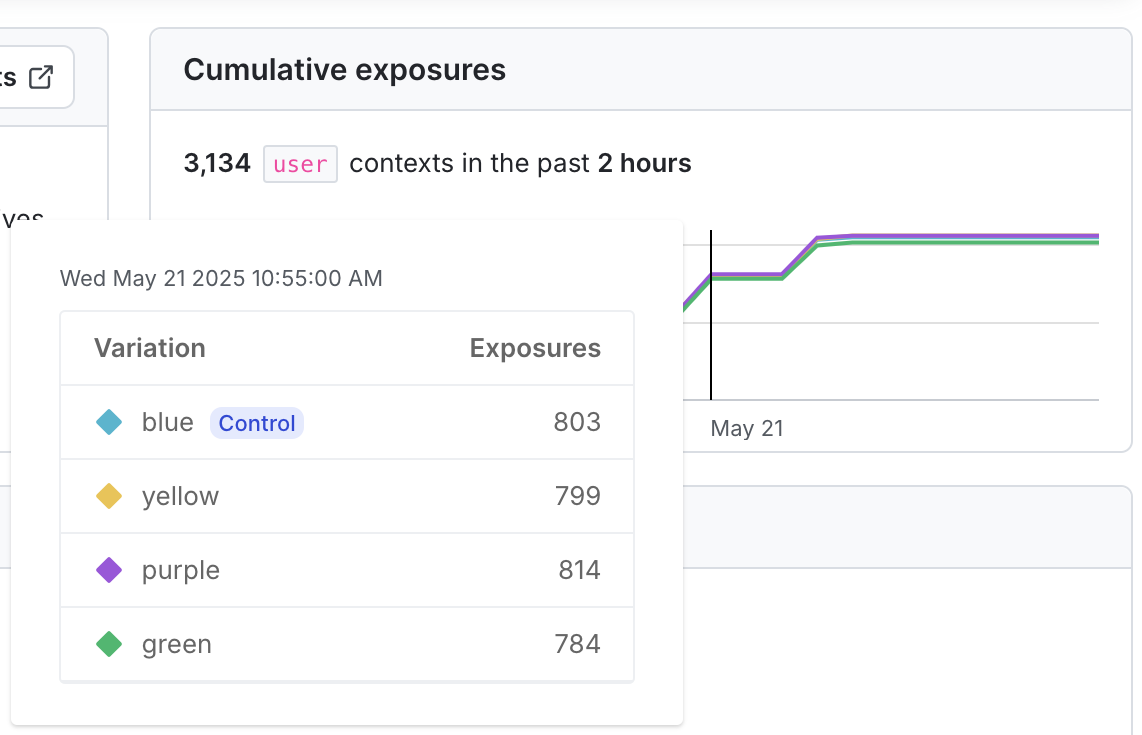
The "Cumulative exposures" section displays how many contexts have encountered each variation over time. Hover on the chart to display a breakdown of how many contexts encountered each variation on a specific date and time.
## Cumulative results
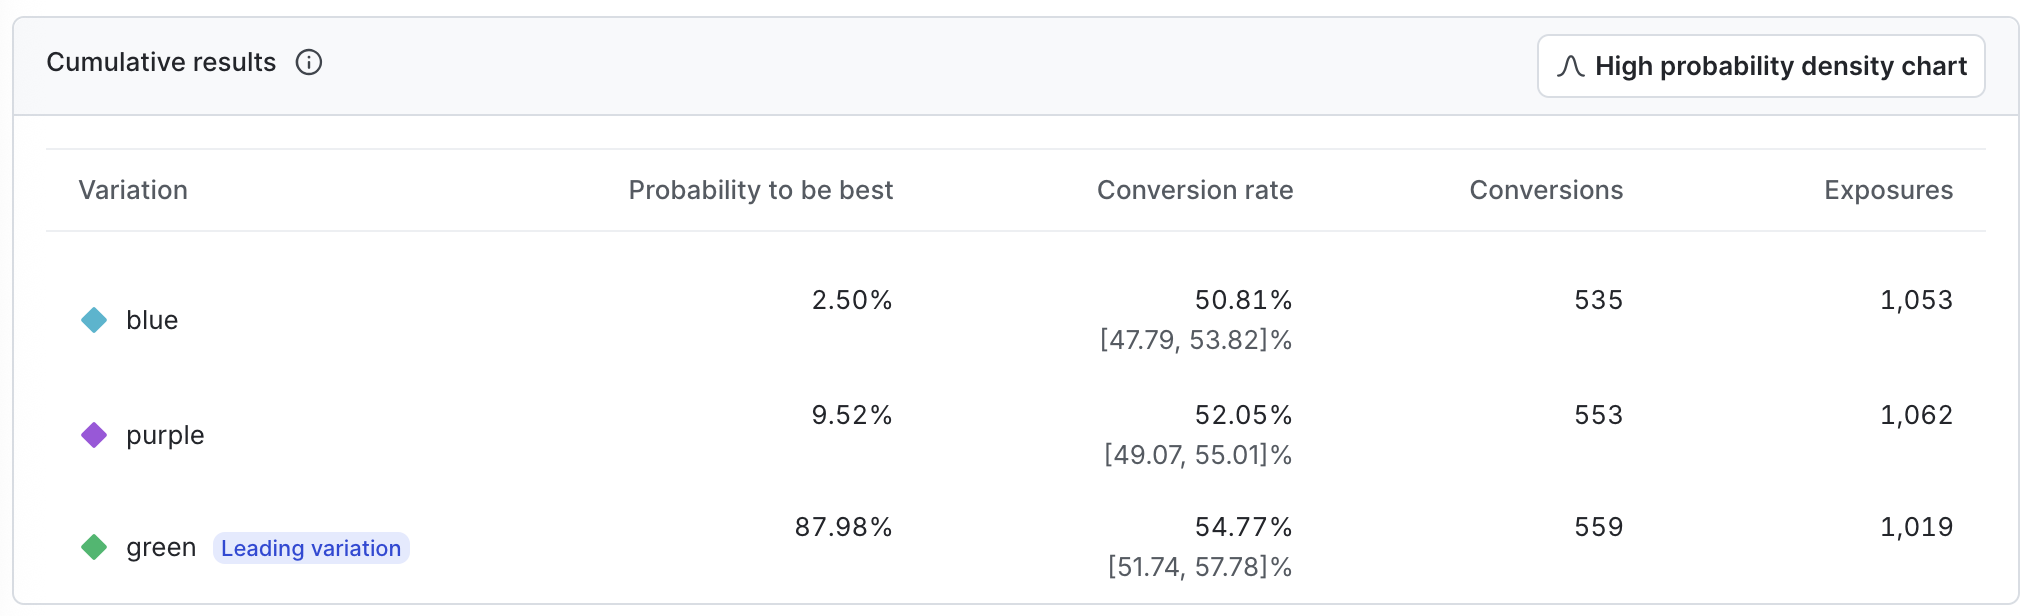
The "Cumulative results" chart displays the leading variation, and, depending on the metric type, columns with information about probability to be best, conversion rate, conversions, mean, and exposures.
### Leading variation
The leading variation is the treatment that currently has the highest probability to be best. As the MAB runs, it will reallocate traffic to the leading variation at the frequency you specified when you created it.
The current leading variation is indicated on the "Cumulative results" chart:
### Probability density
The probability density chart displays the distribution of the results for the metric. Click **Show probability density chart** to display the chart, and **Hide probability density chart** to hide it.
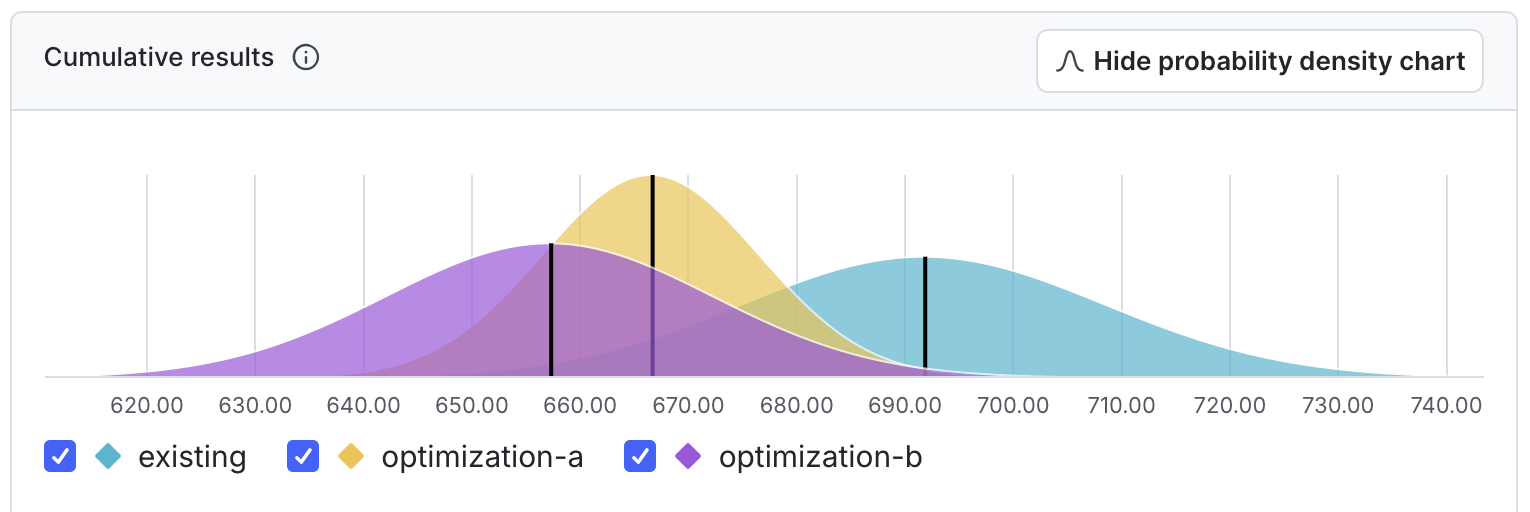
The horizontal x-axis displays the unit of the metric included in the experiment. For example, if the metric is measuring revenue, the unit might be dollars, or if the metric is measuring website latency, the unit might be milliseconds.
If the unit you’re measuring on the x-axis is something you want to increase, such as revenue, account sign ups, and so on, then the farther to the right the curve is, the better. The variation with the curve farthest to the right means the unit the metric is measuring is highest for that variation.
If the unit you’re measuring on the x-axis is something you want to decrease, such as website latency, then the farther to the left the curve is, the better. The variation with the curve farthest to the left means the unit the metric is measuring is lowest for that variation.
How wide a curve is on the x-axis determines the credible interval. Narrower curves mean the results of the variation fall within a smaller range of values, so you can be more confident in the likely results of that variation’s performance.
The vertical y-axis measures probability. You can determine how probable it is that the metric will equal the number on the x-axis by how high the curve is.
### Probability to be best
The probability to be best for a variation is the likelihood that it outperforms all other variations for a specific metric. For MABs, the variation with the highest probability to be best is considered the leading variation.
Additional columns in the "Cumulative results" chart display depending on the metric type you used in the MAB. Expand the sections below to view information for different metric types.
### Binary conversion metrics
Binary conversion metrics include:
* [Custom conversion binary](/home/metrics/custom) metrics
* [Clicked or tapped](/home/metrics/click) metrics using the **Occurrence** option
* [Page viewed](/home/metrics/pageview) metrics using the **Occurrence** option
#### Conversion rate
The value for each unit in a binary conversion metric can be either 1 or
0. A value of 1 means the conversion occurred, such as a user viewing a web page, or submitting a form. A value of 0 means no conversion occurred.
The conversion rate column displays the percentage of units with at least one conversion that you should expect in this experiment, based on the data collected so far. For example, the percentage of users you can expect to click at least once.
#### Conversions
The conversions column displays the total number of users or other contexts that had at least one conversion.
#### Total exposures
The total exposures column displays the total number of contexts that encountered the metric as part of the MAB.
### Count conversion and numeric metrics
Count conversion and numeric metrics include:
* [Custom conversion count](/home/metrics/custom-count) metrics
* [Numeric](/home/metrics/custom-numeric) metrics
* [Clicked or tapped](/home/metrics/click) metrics using the **Count** option
* [Page viewed](/home/metrics/pageview) metrics using the **Count** option
#### Posterior mean
The posterior mean is the variation's average numeric value that you should expect in this experiment, based on the data collected so far.
All of the data in the results table are based on a posterior distribution, which is the combination of the collected data and our prior beliefs about that data. To learn more about posterior distributions, read [Frequentist and Bayesian modeling](/guides/experimentation/bayesian-frequentist#bayesian-and-frequentist-modeling).
LaunchDarkly automatically performs checks on the results data, to make sure that actual context traffic matches the allocation you set. To learn more, read [Sample ratio mismatch](/guides/statistical-methodology/sample-ratios).
#### Total value
The total value is the sum total of all the numbers returned by a numeric metric.
#### Total exposures
The total exposures column displays the total number of contexts that encountered the metric as part of the MAB.